Copyright
©The Author(s) 2015.
World J Cardiol. Aug 26, 2015; 7(8): 442-448
Published online Aug 26, 2015. doi: 10.4330/wjc.v7.i8.442
Published online Aug 26, 2015. doi: 10.4330/wjc.v7.i8.442
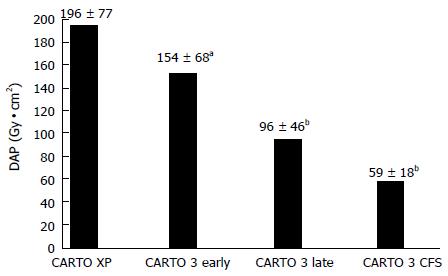
Figure 2 Histogram of dose area product values (in Gy•cm2) for the whole procedure of pulmonary vein isolation in the same cohorts shown in Figure 1.
As in Figure 1, there is a progressive and significant reduction in radiation exposure, expressed by the dose area product value. aP < 0.05 vs the previous cohort; bP < 0.0001 vs the previous cohort. DAP: Dose area product; CFS: Contact force sensing.
- Citation: Ponti RD. Reduction of radiation exposure in catheter ablation of atrial fibrillation: Lesson learned. World J Cardiol 2015; 7(8): 442-448
- URL: https://www.wjgnet.com/1949-8462/full/v7/i8/442.htm
- DOI: https://dx.doi.org/10.4330/wjc.v7.i8.442


