Copyright
©The Author(s) 2022.
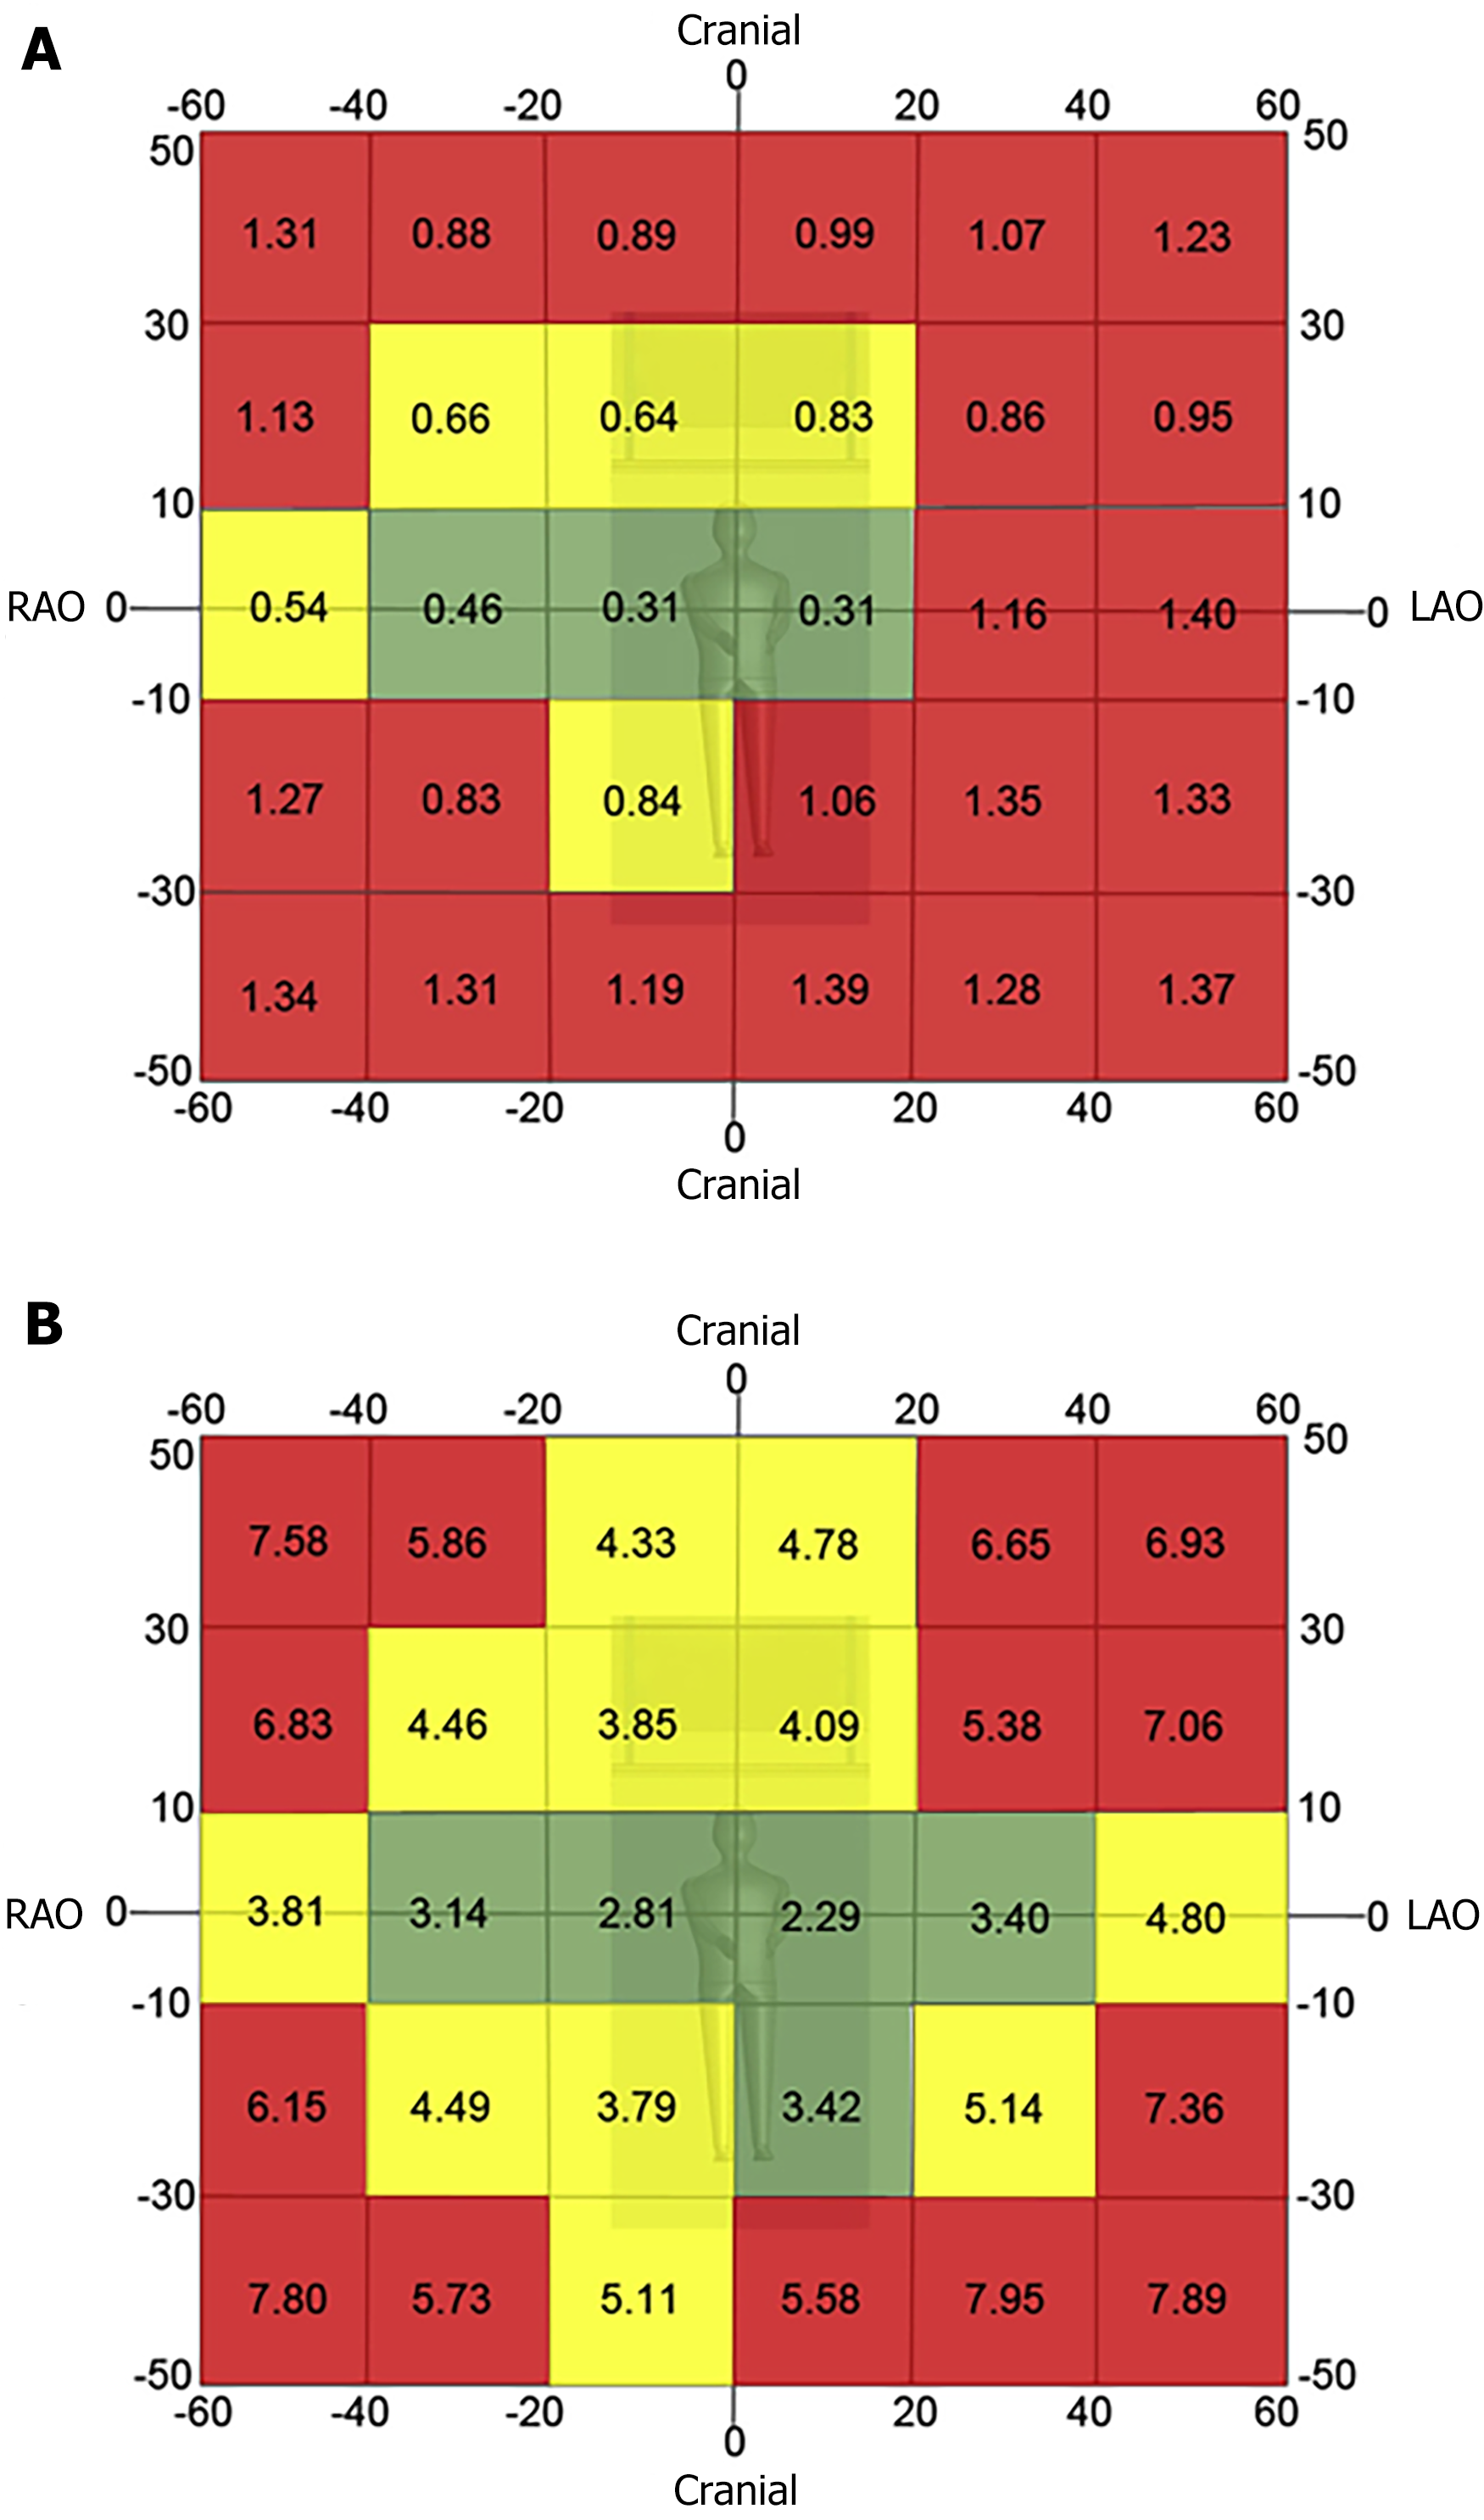
Figure 2 Two-dimensional radiation map for fluoroscopy (A) and acquisition imaging (B).
The red zone denotes projections where < 26% of the image procurement occurred in the lowest tertile of Air Kerma rate. The yellow zone denotes projection where 26% to 40% of the images were procured in the lowest tertile of air kerma rate the value in each cell represents the median Air Kerma rate for the respective projection. Reproduced with permission from reference 8[3]. LAO: Left anterior oblique view; RAO: Right anterior oblique view.
- Citation: Gutierrez-Barrios A, Cañadas-Pruaño D, Noval-Morillas I, Gheorghe L, Zayas-Rueda R, Calle-Perez G. Radiation protection for the interventional cardiologist: Practical approach and innovations. World J Cardiol 2022; 14(1): 1-12
- URL: https://www.wjgnet.com/1949-8462/full/v14/i1/1.htm
- DOI: https://dx.doi.org/10.4330/wjc.v14.i1.1


