Copyright
©The Author(s) 2021.
World J Cardiol. Oct 26, 2021; 13(10): 533-545
Published online Oct 26, 2021. doi: 10.4330/wjc.v13.i10.533
Published online Oct 26, 2021. doi: 10.4330/wjc.v13.i10.533
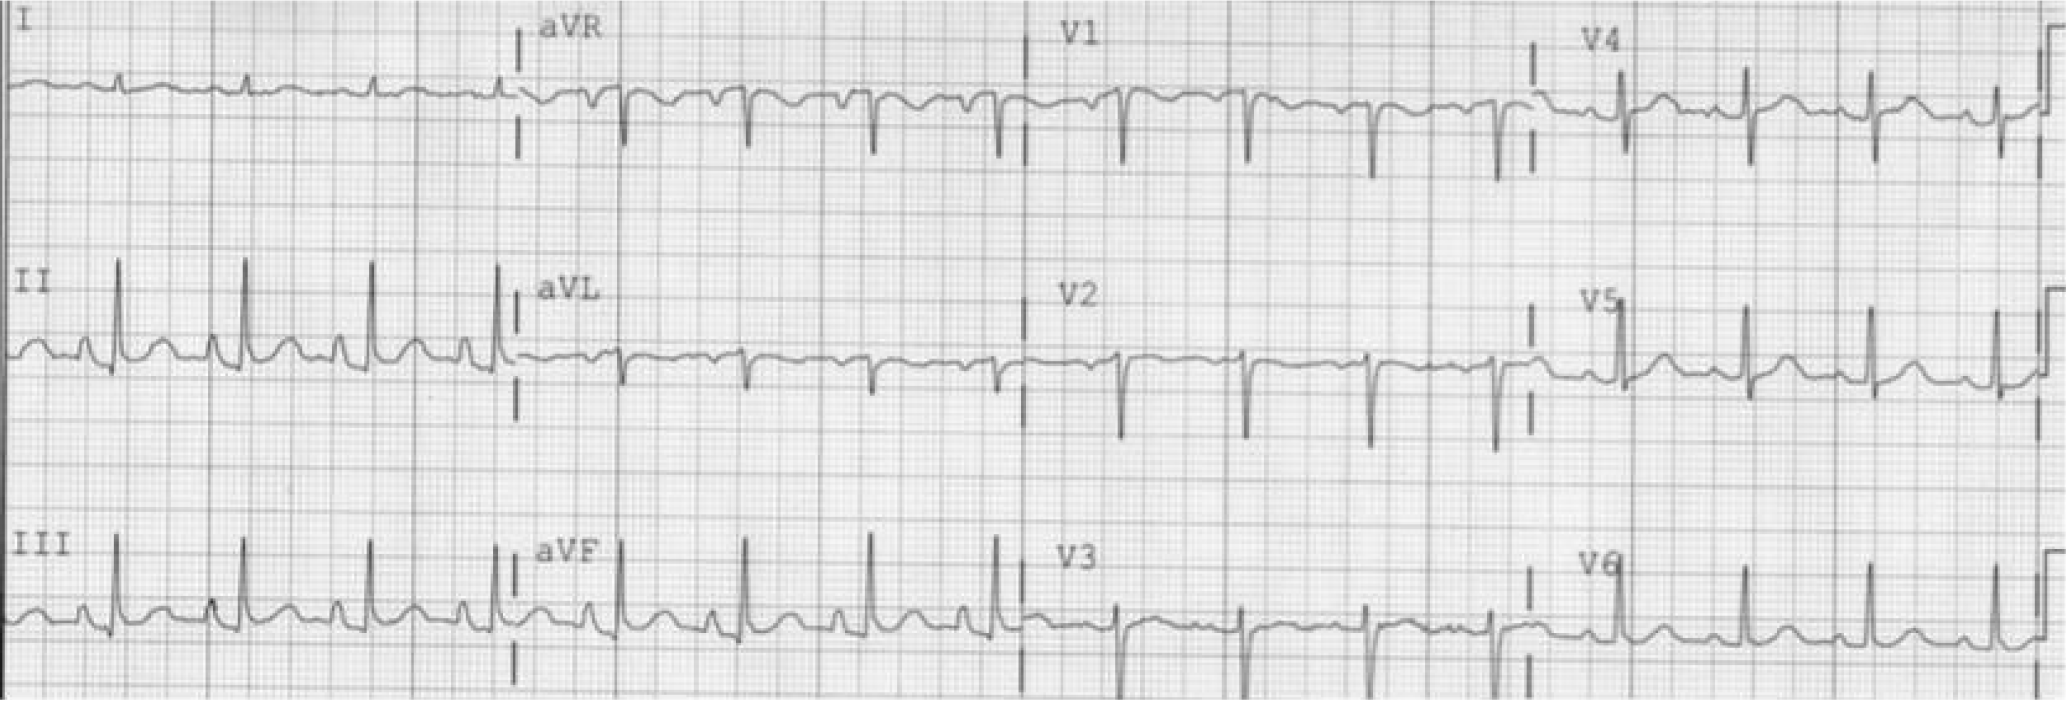
Figure 1 Electrocardiogram showing vertical P wave axis suggested by P wave amplitude in lead III greater than P wave in lead I and a negative P wave in lead aVL.
Adapted from Bajaj et al[13].
- Citation: Gupta P, Jain H, Gill M, Bharaj G, Khalid N, Chaudhry W, Chhabra L. Electrocardiographic changes in Emphysema. World J Cardiol 2021; 13(10): 533-545
- URL: https://www.wjgnet.com/1949-8462/full/v13/i10/533.htm
- DOI: https://dx.doi.org/10.4330/wjc.v13.i10.533


