Copyright
©The Author(s) 2020.
World J Cardiol. Apr 26, 2020; 12(4): 123-135
Published online Apr 26, 2020. doi: 10.4330/wjc.v12.i4.123
Published online Apr 26, 2020. doi: 10.4330/wjc.v12.i4.123
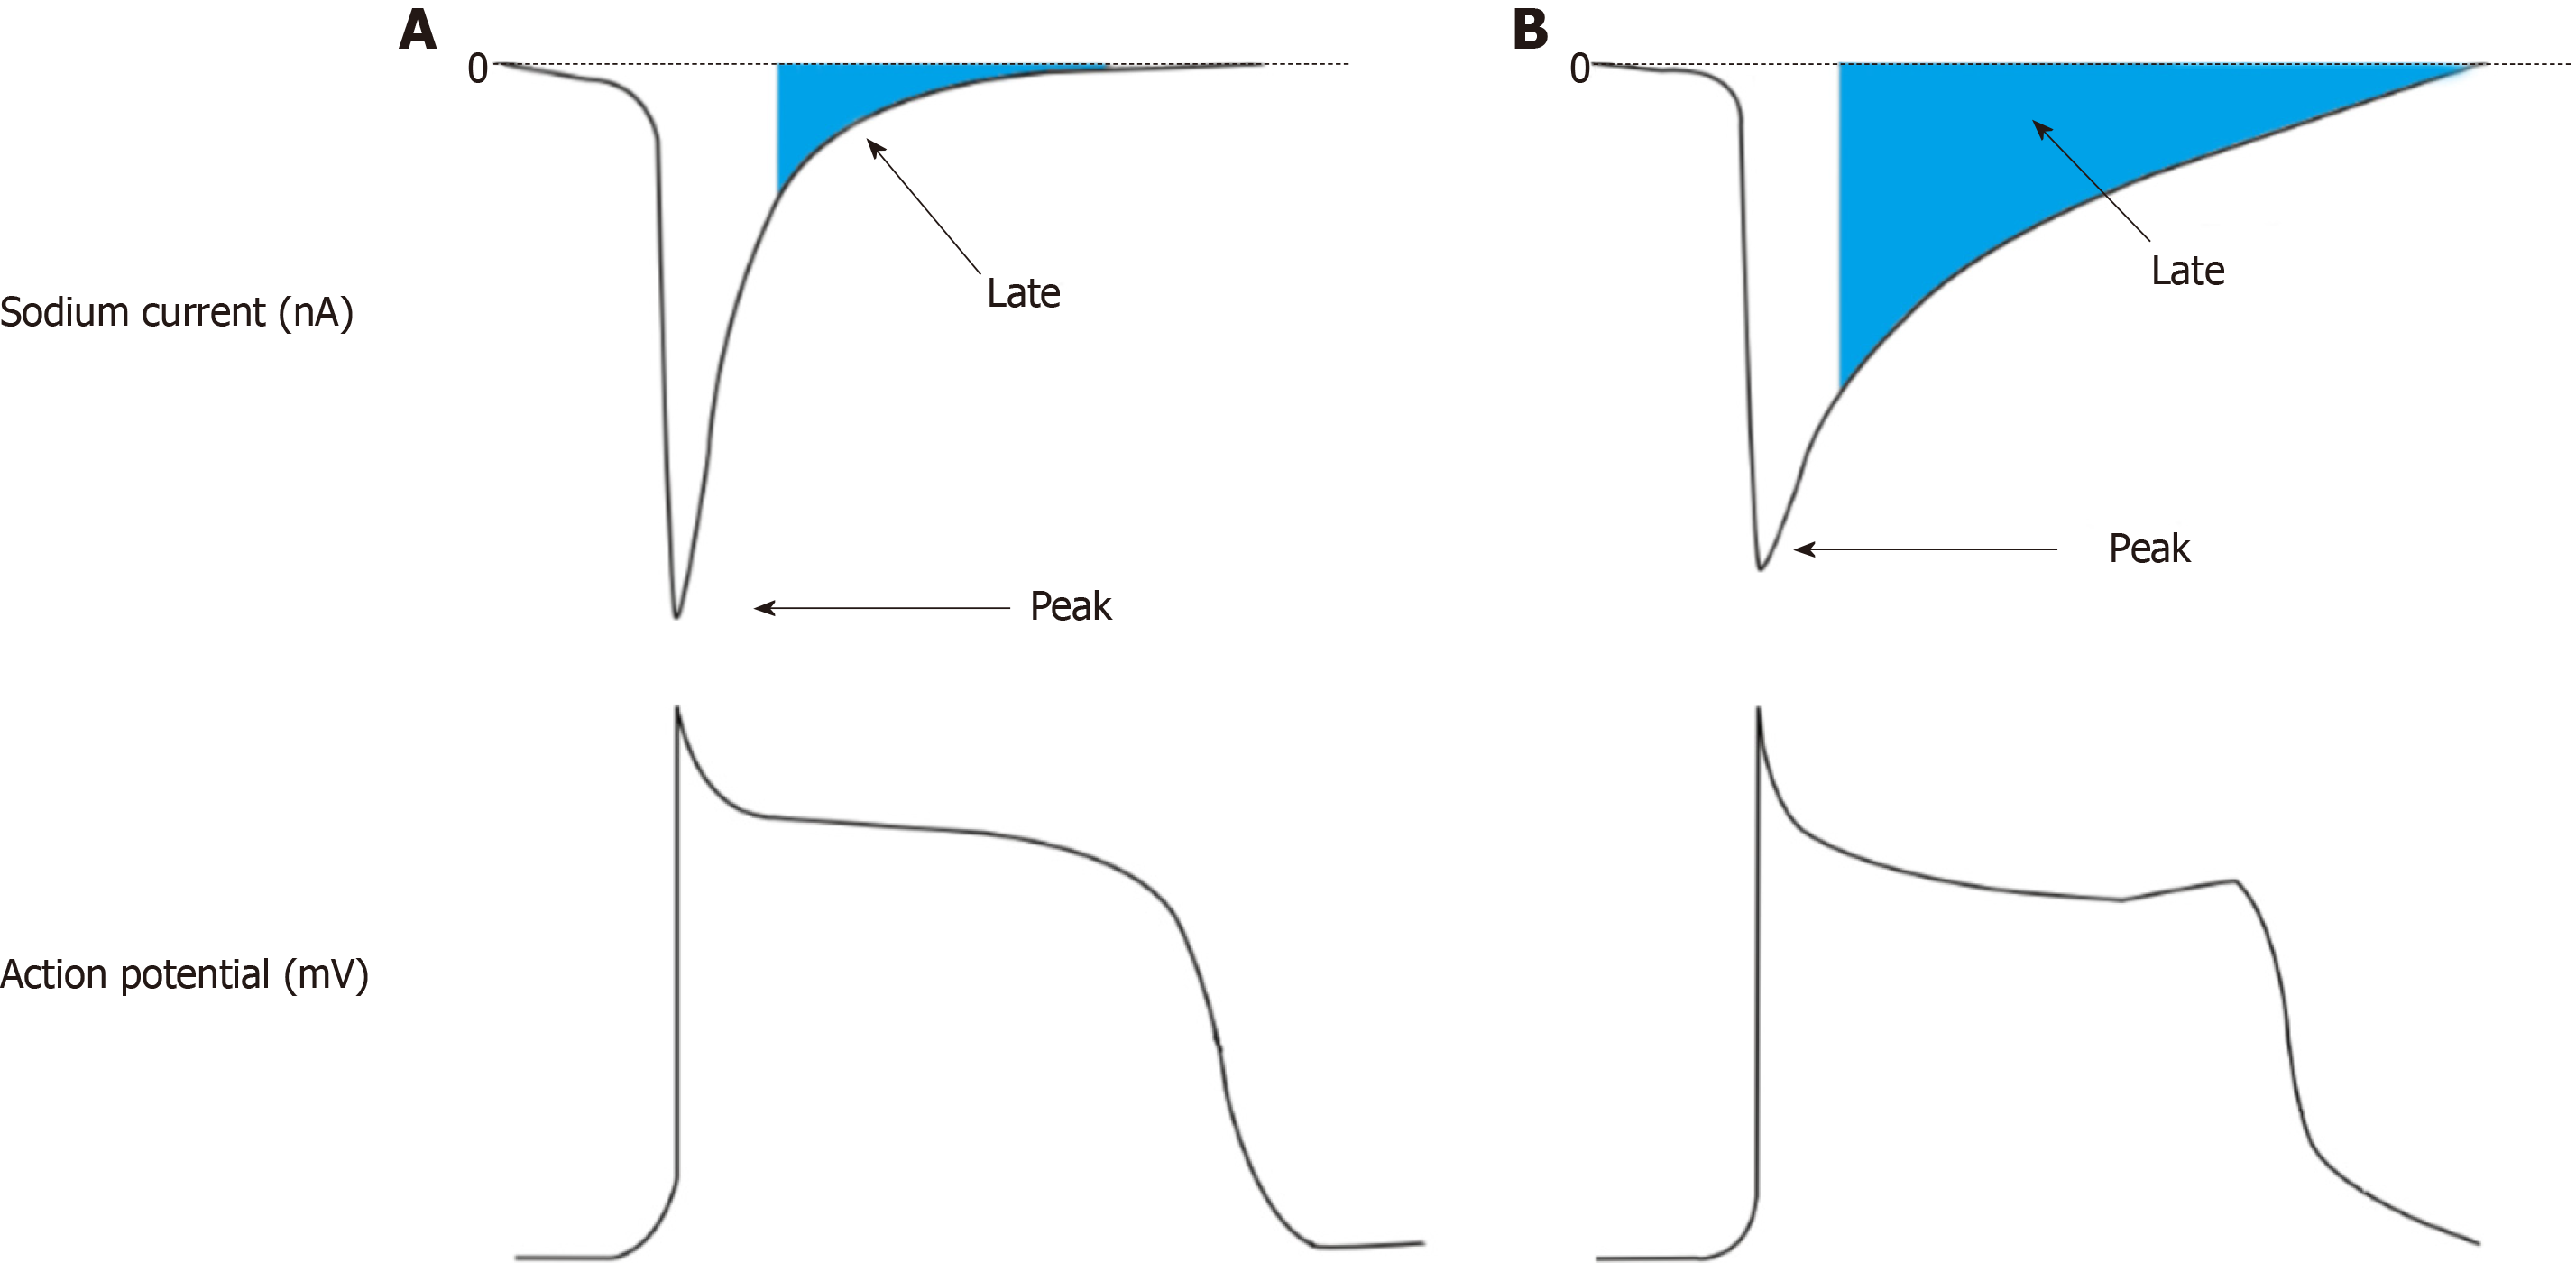
Figure 1 Peak and Late sodium currents on action potential morphology.
A: Top left: An illustration of a normal sodium current within a cardiomyocyte with its rapid peak current and short late current; Bottom left: An action potential as a result of normal sodium ion influx. Plateau and repolarisation phases are not prolonged and no afterdepolarizations present; B: Top right: An Illustration of a pathologically enhanced late sodium current; Bottom right: An action potential as a consequence of enhanced late sodium current with a prolonged plateau and repolarisation period. The late upstroke between phase 2 and phase 3 represents an after depolarisation brought about due to the aberrant late sodium current. Adapted from Vadnais et al[74], 2010 with permission.
- Citation: Isaac E, Cooper SM, Jones SA, Loubani M. Do age-associated changes of voltage-gated sodium channel isoforms expressed in the mammalian heart predispose the elderly to atrial fibrillation? World J Cardiol 2020; 12(4): 123-135
- URL: https://www.wjgnet.com/1949-8462/full/v12/i4/123.htm
- DOI: https://dx.doi.org/10.4330/wjc.v12.i4.123


