Copyright
©The Author(s) 2018.
World J Cardiol. Oct 26, 2018; 10(10): 165-186
Published online Oct 26, 2018. doi: 10.4330/wjc.v10.i10.165
Published online Oct 26, 2018. doi: 10.4330/wjc.v10.i10.165
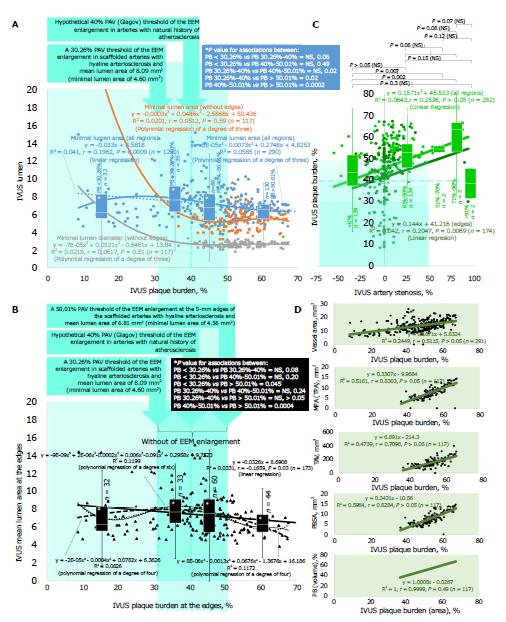
Figure 5 The external elastic membrane enlargement and Glagovian artery remodeling.
A, B: Character regression analysis of the associations between plaque burden (PB) and lumen geometry verified by intravascular ultrasound (IVUS). The linear and polynomial regression of the different degrees at the regions of scaffold and edges bared two boundaries (30.26% and 50.01%) of the phenomenon of the external elastic membrane (EEM) enlargement (shown with a vertical stripe). The further box-and-whisker analysis was from four PB distributions (PB < 30.26%, PB 30.26%-40%, PB 40%-50.01%, and PB > 50.01%) to assess patterns of the Glagovian artery remodeling; C, D: The comparison of PB with artery stenosis (adjusted by the mean reference area) with a five-distribution box-and-whisker analysis (artery stenosis < 0%, 0%-50%, 51%-70%, 71%-90%, and > 91%); The upper boundary of the window of the EEM enlargement where artery stenosis was no more than 45% (C). The associations between IVUS PB and other variables characterizing the lesion geometry were estimated (D). The P value was calculated for comparison of one or two variables in order to either examine the means of two groups (paired or unpaired t test) or test statistical consistency for regression. The figure was adapted from ref. [34]. n: Number of observations; PAV: Percent atheroma volume; R2: Coefficient of determination; r: Pearson correlation (for linear regression); IQR: Interquartile range; NS: Non-significant (P > 0.05); PBSA: Plaque behind stent area; TAV: Total atheroma volume; MPA: Mean plaque area.
- Citation: Kharlamov AN. Undiscovered pathology of transient scaffolding t1remains a driver of failures in clinical trials. World J Cardiol 2018; 10(10): 165-186
- URL: https://www.wjgnet.com/1949-8462/full/v10/i10/165.htm
- DOI: https://dx.doi.org/10.4330/wjc.v10.i10.165


