Copyright
©The Author(s) 2016.
World J Biol Chem. Feb 26, 2016; 7(1): 188-205
Published online Feb 26, 2016. doi: 10.4331/wjbc.v7.i1.188
Published online Feb 26, 2016. doi: 10.4331/wjbc.v7.i1.188
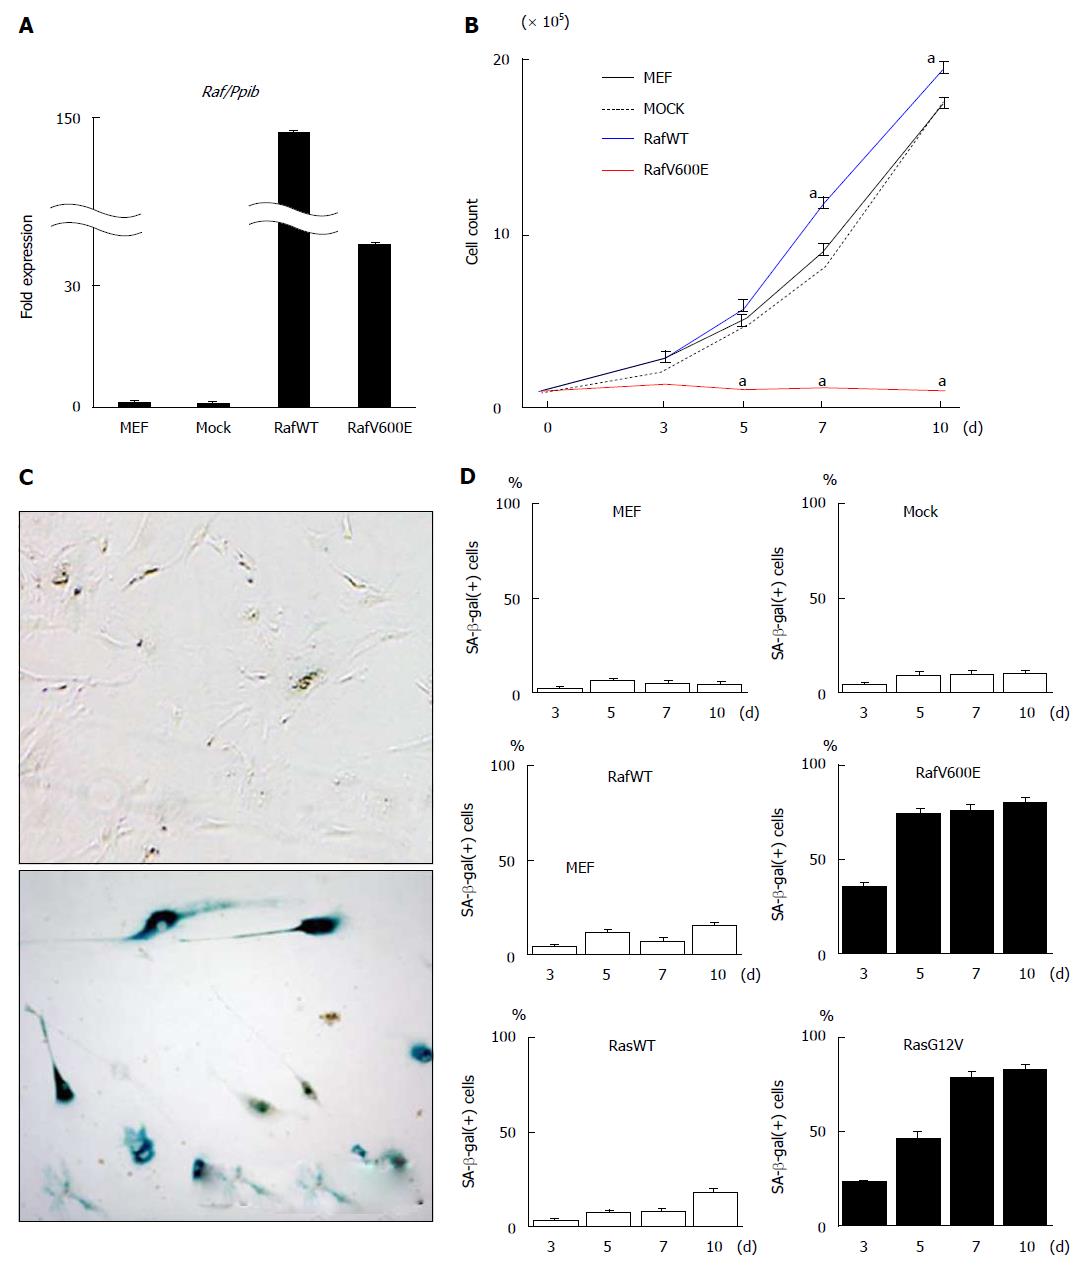
Figure 1 Induction of cellular senescence in mouse embryonic fibroblast by oncogenic Raf.
A: Induction of Raf by retroviral infection. Retrovirus was infected to MEFs on day -2 to induce the expression of wild type Raf (RafWT) or oncogenic Raf (RafV00E). RNA was collected on day 7, and the expression level of BRAF was analyzed by real-time RT-PCR to confirm expression induction; B: Growth curve. Retrovirus was infected into MEFs on day -2. After two days (day 0), the cell number was counted to draw the growth curve. Cells that were infected with mock retrovirus Mock cells (black dotted line) showed cellular growth similar to that of MEF cells without infection (black line), and RafWT cells (blue line) showed slightly but significantly faster growth than did MEF cells without infection. RafV600E cells hardly showed cellular growth (red line). aP < 0.05 (t); C: SA-β-gal staining. Compared with MEF cells on day 7 (above), RafV600E cells on day 7 (bottom) showed positive staining of SA-β-gal; D: Count of SA-β-gal(+) cells. The number of SA-β-gal(+) cells was counted on days 3, 5, 7, and 10. MEF cells without virus infection rarely showed SA-β-gal(+) cells. While mock cells and RafWT cells did not show a marked increase in the number of SA-β-gal(+) cells, RafV600E cells showed a marked increase in the number of SA-β-gal(+) cells after day 5 (73.3% ± 2.9% on day 5). When cells were infected with retrovirus of oncogenic Ras (RasG12V) and wild type Ras (RasWT) as previous study[22], RasG12V cells showed marked increase of SA-β-gal(+) cells after day 7 (showed 78.3% ± 4.5% on day 7), while RasWT cells did not until day 10. The mean and standard error in three repeated experiments were shown. MEF: Mouse embryonic fibroblast.
- Citation: Fujimoto M, Mano Y, Anai M, Yamamoto S, Fukuyo M, Aburatani H, Kaneda A. Epigenetic alteration to activate Bmp2-Smad signaling in Raf-induced senescence. World J Biol Chem 2016; 7(1): 188-205
- URL: https://www.wjgnet.com/1949-8454/full/v7/i1/188.htm
- DOI: https://dx.doi.org/10.4331/wjbc.v7.i1.188


