Copyright
©The Author(s) 2015.
World J Biol Chem. Nov 26, 2015; 6(4): 366-378
Published online Nov 26, 2015. doi: 10.4331/wjbc.v6.i4.366
Published online Nov 26, 2015. doi: 10.4331/wjbc.v6.i4.366
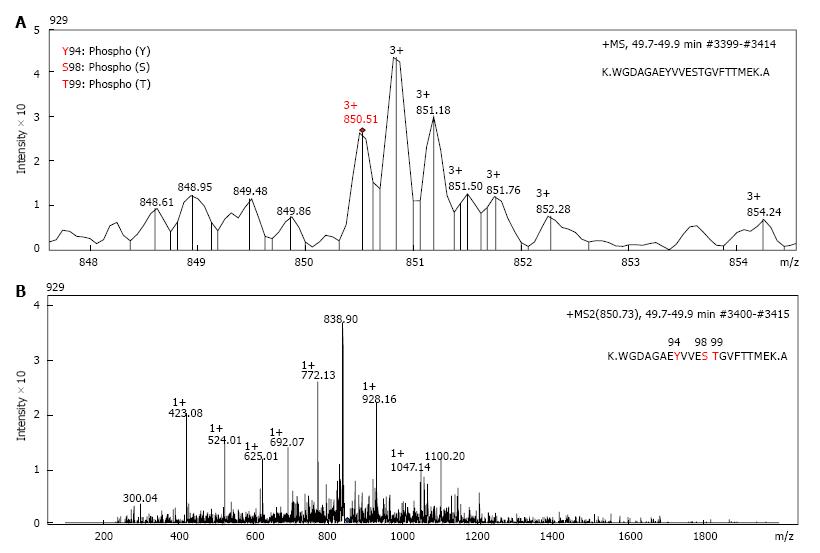
Figure 2 The tandem mass spectrometry (MS/MS) profile of glyceraldehyde 3-phosphate dehydrogenase peptides.
Proteomics characterization of a basic GAPDH isoform (spot 1 from Figure 1B) from the cytosolic fraction of A549 cells by mass spectroscopy. A: Spectrum profile of the precursor ion 850.51 m/z (MS 1) selected for further fragmentation; B: Spectrum profile of the fragmentation ions (MS 2) of the peak 850.51 m/z from panel A. Retention time and number of scans where the peptide was detected are shown in the right top part of each panel. GAPDH: Glyceraldehyde 3-phosphate. dehydrogenase.
- Citation: Phadke M, Krynetskaia N, Mishra A, Barrero C, Merali S, Gothe SA, Krynetskiy E. Disruption of NAD+ binding site in glyceraldehyde 3-phosphate dehydrogenase affects its intranuclear interactions. World J Biol Chem 2015; 6(4): 366-378
- URL: https://www.wjgnet.com/1949-8454/full/v6/i4/366.htm
- DOI: https://dx.doi.org/10.4331/wjbc.v6.i4.366


