Copyright
©2011 Baishideng Publishing Group Co.
World J Biol Chem. Jan 26, 2011; 2(1): 14-24
Published online Jan 26, 2011. doi: 10.4331/wjbc.v2.i1.14
Published online Jan 26, 2011. doi: 10.4331/wjbc.v2.i1.14
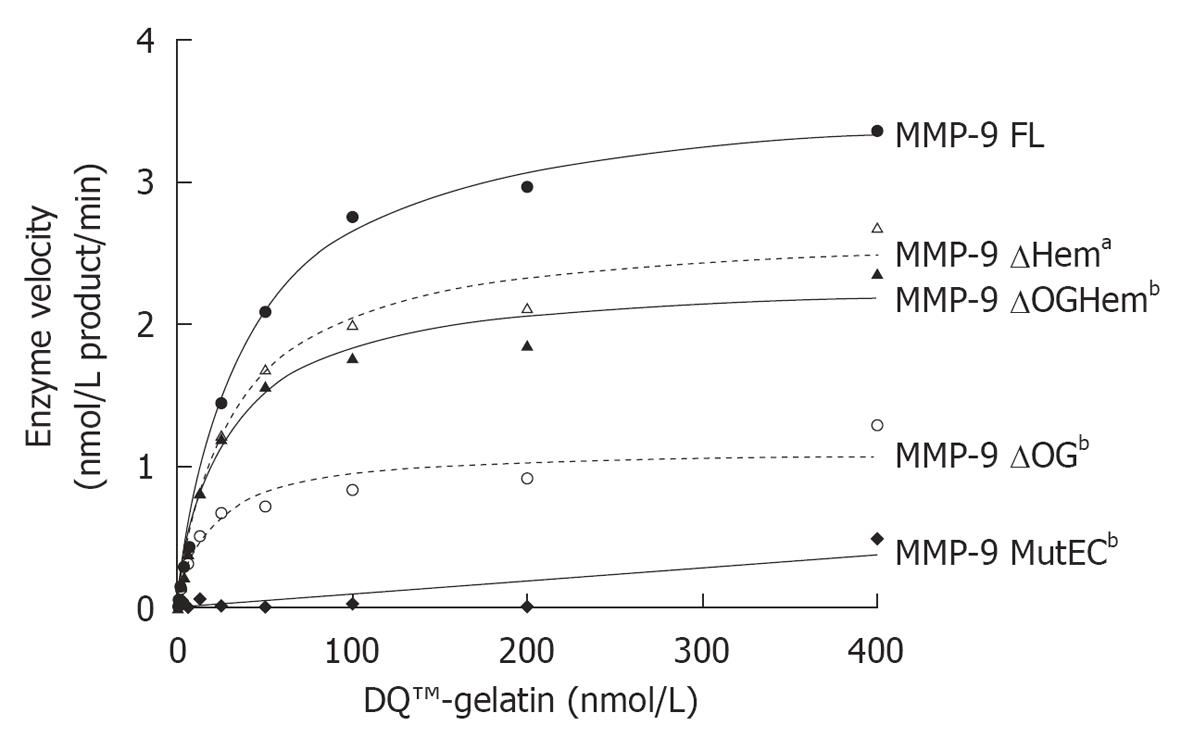
Figure 3 Enzyme velocity as a function of the amount of substrate (nmol/L DQ™-gelatin) (at a concentration of 1 nmol/L).
Prism 5 (GraphPad Software, Inc) was used to fit the data with the corresponding Michaelis-Menten curve and to calculate the Vmax and KM values (Table 2). By using a Wilcoxon signed rank test we determined that all mutants had a significantly different activity from that of matrix metalloproteinase (MMP)-9 FL (aP < 0.05, bP < 0.01). The graphs are representative of three independent experiments.
- Citation: Vandooren J, Geurts N, Martens E, Steen PEVD, Jonghe SD, Herdewijn P, Opdenakker G. Gelatin degradation assay reveals MMP-9 inhibitors and function of O-glycosylated domain. World J Biol Chem 2011; 2(1): 14-24
- URL: https://www.wjgnet.com/1949-8454/full/v2/i1/14.htm
- DOI: https://dx.doi.org/10.4331/wjbc.v2.i1.14


