Copyright
©The Author(s) 2015.
World J Diabetes. May 15, 2015; 6(4): 662-672
Published online May 15, 2015. doi: 10.4239/wjd.v6.i4.662
Published online May 15, 2015. doi: 10.4239/wjd.v6.i4.662
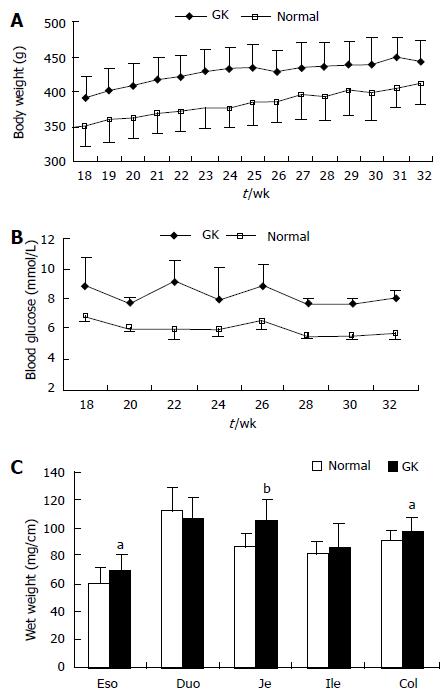
Figure 1 Body weight (A) and the blood glucose level (B) were higher in Goto-Kakizak group than in the normal group (P < 0.
001 and P < 0.01). The wet weight per unit length of intestinal and colon segments is shown in Figure 1C (compared with normal group: aP < 0.05, bP < 0.01). Values are mean ± SD, n = 8 for each group. Eso: Esophagus; Duo: Duodenum; Je: Jejunum; Ile: Ileum; Col: Colon; GK: Inherited type 2 diabetic Goto-Kakizak rats.
- Citation: Chen PM, Gregersen H, Zhao JB. Advanced glycation end-product expression is upregulated in the gastrointestinal tract of type 2 diabetic rats. World J Diabetes 2015; 6(4): 662-672
- URL: https://www.wjgnet.com/1948-9358/full/v6/i4/662.htm
- DOI: https://dx.doi.org/10.4239/wjd.v6.i4.662


