Copyright
©The Author(s) 2015.
World J Diabetes. May 15, 2015; 6(4): 626-633
Published online May 15, 2015. doi: 10.4239/wjd.v6.i4.626
Published online May 15, 2015. doi: 10.4239/wjd.v6.i4.626
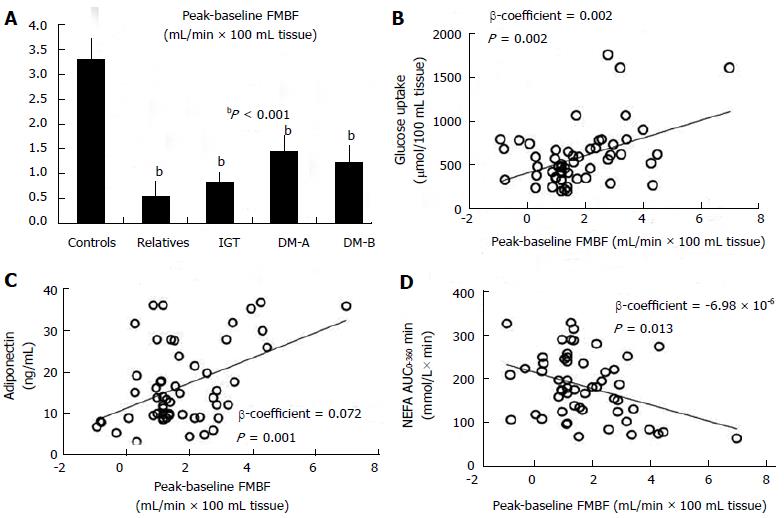
Figure 1 Forearm muscle blood flow peak-baseline values in all groups (A), and associations between peak-baseline forearm muscle blood flow and forearm muscle glucose uptake (B), plasma adiponectin (C) and postprandial non-esterified fatty acids (D), in subjects at all stages of type 2 diabetes.
A: bP overall < 0.001; B: Forearm muscle glucose uptake = 427.9 + 101.4 peak-baseline FMBF, P = 0.001; C: Adiponectin = 12.17 + 3.05 peak-baseline FMBF, P < 0.001; D: Postprandial NEFA (AUC0-360) = 209.5 - 18.52 peak-baseline FMBF, P = 0.005. FMBF: Forearm muscle blood flow; NEFAs: Non-esterified fatty acids. IGT: Impaired glucose tolerance; DM: Diabetes mellitus. Adapted from Lambadiari et al[46].
- Citation: Lambadiari V, Triantafyllou K, Dimitriadis GD. Insulin action in muscle and adipose tissue in type 2 diabetes: The significance of blood flow. World J Diabetes 2015; 6(4): 626-633
- URL: https://www.wjgnet.com/1948-9358/full/v6/i4/626.htm
- DOI: https://dx.doi.org/10.4239/wjd.v6.i4.626


