Copyright
©The Author(s) 2015.
World J Diabetes. May 15, 2015; 6(4): 576-582
Published online May 15, 2015. doi: 10.4239/wjd.v6.i4.576
Published online May 15, 2015. doi: 10.4239/wjd.v6.i4.576
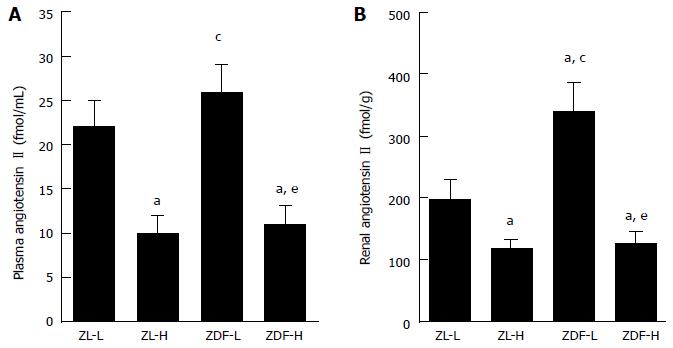
Figure 4 Plasma and kidney concentration of angiotensin II in type 2 diabetic model (Zucker diabetic fatty rat) and control rat (Zucker lean rat).
ZL-L and ZL-H indicate ZL fed normal and high salt diet, respectively. Alike, ZDF-L, ZDF-H describe ZDF fed normal and high salt diet, respectively. aP < 0.05 vs ZL-L, cP < 0.05 vs ZL-H, eP < 0.05 vs ZDF-L[18]. ZDF: Zucker diabetic fatty rat; ZL: Zucker lean rat.
- Citation: Takenaka T, Inoue T, Watanabe Y. How the kidney hyperfiltrates in diabetes: From molecules to hemodynamics. World J Diabetes 2015; 6(4): 576-582
- URL: https://www.wjgnet.com/1948-9358/full/v6/i4/576.htm
- DOI: https://dx.doi.org/10.4239/wjd.v6.i4.576


