Copyright
©The Author(s) 2015.
World J Diabetes. Apr 15, 2015; 6(3): 500-507
Published online Apr 15, 2015. doi: 10.4239/wjd.v6.i3.500
Published online Apr 15, 2015. doi: 10.4239/wjd.v6.i3.500
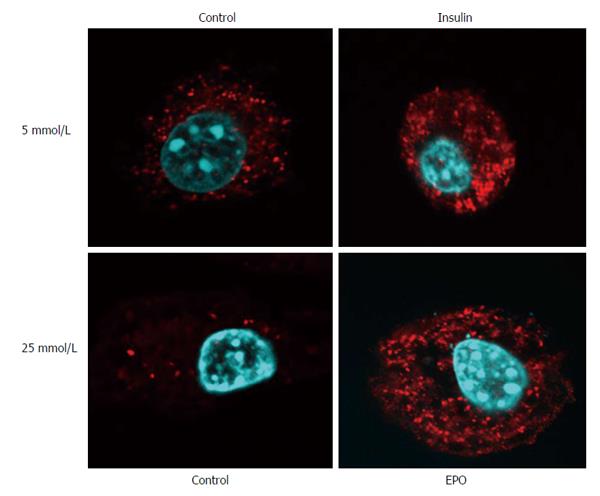
Figure 5 GLUT4 translocation (red fluorescence) after a 30 min treatment with insulin (400 nmol/L) or r-mo-erythropoietin (40 ng/mL) in 3T3-L1 adipocytes cultured in high glucose (25 mmol/L) or normal glucose (5 mmol/L) medium compared with that in untreated cells (Control).
Nuclei are shown with blue fluorescence. The GLUT4 translocation was apparent after both the erythropoietin (EPO) and insulin treatments, whereas it was not present in untreated cells. Representative images are shown from n = 3 independent experiments. Republished with permission of Georg Thieme Verlag KG Stuttgart, New York from Mikolás et al[37].
- Citation: Molnár GA, Mikolás EZ, Szijártó IA, Kun S, Sélley E, Wittmann I. Tyrosine isomers and hormonal signaling: A possible role for the hydroxyl free radical in insulin resistance. World J Diabetes 2015; 6(3): 500-507
- URL: https://www.wjgnet.com/1948-9358/full/v6/i3/500.htm
- DOI: https://dx.doi.org/10.4239/wjd.v6.i3.500


