Copyright
©The Author(s) 2015.
World J Diabetes. Sep 10, 2015; 6(11): 1186-1197
Published online Sep 10, 2015. doi: 10.4239/wjd.v6.i11.1186
Published online Sep 10, 2015. doi: 10.4239/wjd.v6.i11.1186
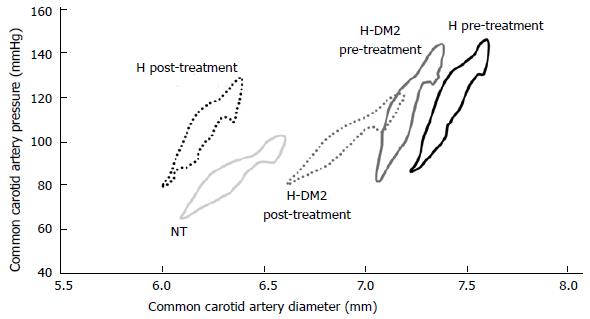
Figure 1 Pressure and diameter plot.
The instantaneous pressure-diameter loops are shown, which were obtained from: H pre-treatment: Hypertensive patients without diabetes mellitus (DM) before administration of ramipril; H post-treatment: Hypertensive patients without DM after administration of ramipril; H-DM2 pre-treatment: Hypertensive patients with type 2 DM before ramipril administration; H-DM2 post-treatment: Hypertensive patients with type 2 Diabetes after ramipril administration; NT: Normotensive subjects. Adapt from Christen et al[23].
- Citation: Sanchez RA, Sanabria H, Santos CL, Ramirez AJ. Incretins and selective renal sodium-glucose co-transporter 2 inhibitors in hypertension and coronary heart disease. World J Diabetes 2015; 6(11): 1186-1197
- URL: https://www.wjgnet.com/1948-9358/full/v6/i11/1186.htm
- DOI: https://dx.doi.org/10.4239/wjd.v6.i11.1186


