Copyright
©2014 Baishideng Publishing Group Co.
World J Diabetes. Apr 15, 2014; 5(2): 97-114
Published online Apr 15, 2014. doi: 10.4239/wjd.v5.i2.97
Published online Apr 15, 2014. doi: 10.4239/wjd.v5.i2.97
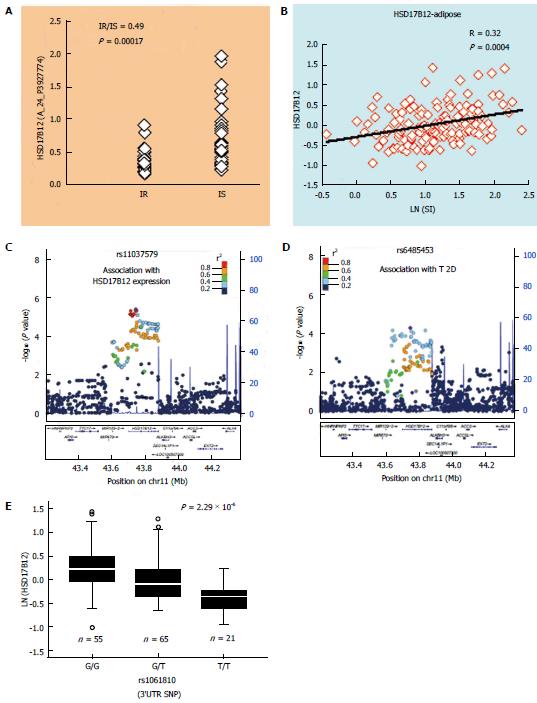
Figure 3 Prioritizing type 2 diabetes-associated variants by expression quantitative trait loci analysis: An example.
HSD17B12 is one of 172 genes differentially expressed in adipose tissue of insulin-resistant (IR, n = 31) vs insulin-sensitive (IS, n = 31) subjects in a genome-wide study (A) by Elbein et al[76]. Its expression in subcutaneous adipose of non-diabetic subjects (n = 141) also shows a significant correlation (B) with insulin sensitivity (SI). Strongest cis-eSNP for adipose tissue (C) expression of HSD17B12 (in adipose eQTL from the MuTHER project)[55] is also associated with T2D (D) in a large GWAS meta-analysis (in DIAGRAM.v3 data from 12171 T2D and 56862 controls)[13]. This locus also includes a 3’UTR SNP rs1061810 that shows association (E) with T2D and expression of HSD17B12 (in qRT-PCR analysis in adipose tissue from 141 non-diabetic subjects). eSNP: Expression regulatory SNP; eQTL: Expression quantitative trait loci; T2D: Type 2 diabetes.
- Citation: Das SK, Sharma NK. Expression quantitative trait analyses to identify causal genetic variants for type 2 diabetes susceptibility. World J Diabetes 2014; 5(2): 97-114
- URL: https://www.wjgnet.com/1948-9358/full/v5/i2/97.htm
- DOI: https://dx.doi.org/10.4239/wjd.v5.i2.97


