Copyright
©2014 Baishideng Publishing Group Co.
World J Diabetes. Apr 15, 2014; 5(2): 97-114
Published online Apr 15, 2014. doi: 10.4239/wjd.v5.i2.97
Published online Apr 15, 2014. doi: 10.4239/wjd.v5.i2.97
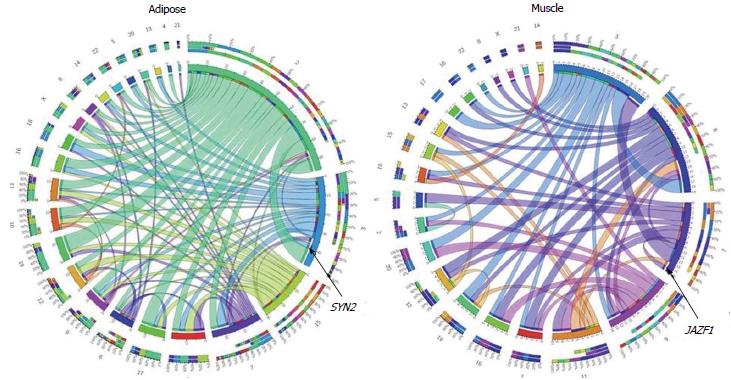
Figure 2 Type 2 diabetes or glucose homeostasis traits associated variants are expression regulatory SNP.
We tested Cis and Trans regulatory role of 68 SNPs that showed reproducible associations with T2D or Glucose homeostasis traits[72]. At a threshold of P < 0.0001, 25 and 19 of these SNPs in adipose and muscle, respectively, showed association with expression of a cis- or trans-transcript. This figure represents a CIRCOS plot of eQTL and eSNP chromosomal location relationships, indicating the predominance of trans-regulation among 183 and 62 significant (P < 0.0001) eQTL-eSNPs associations in adipose and muscle respectively. Rare cis-regulation (SYN2 in adipose and JAZF1 in muscle) is marked. eSNP: Expression regulatory SNP; eQTL: Expression quantitative trait loci; T2D: Type 2 diabetes.
- Citation: Das SK, Sharma NK. Expression quantitative trait analyses to identify causal genetic variants for type 2 diabetes susceptibility. World J Diabetes 2014; 5(2): 97-114
- URL: https://www.wjgnet.com/1948-9358/full/v5/i2/97.htm
- DOI: https://dx.doi.org/10.4239/wjd.v5.i2.97


