Copyright
©2014 Baishideng Publishing Group Co.
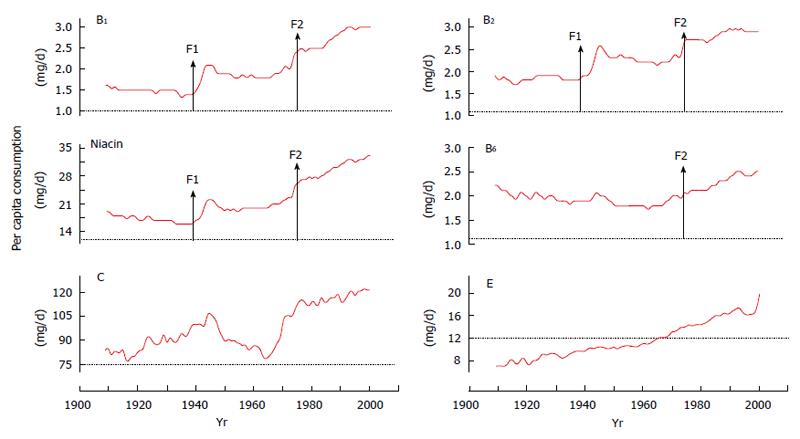
Figure 2 United States per capita daily vitamin consumption in 1909-2000.
Data are from the Economic Research Service of the United States Department of Agriculture (http://search.ers.usda.gov/searchaffiliate=ers&query=nutrients.xls). Red line indicates per capita consumption. Dot line indicates EAR. F1: Initiation of flour fortification; F2: Update of nutrient fortification standards for breakfast cereals in 1974[34]; EAR: The estimated daily average requirement.
- Citation: Zhou SS, Zhou Y. Excess vitamin intake: An unrecognized risk factor for obesity. World J Diabetes 2014; 5(1): 1-13
- URL: https://www.wjgnet.com/1948-9358/full/v5/i1/1.htm
- DOI: https://dx.doi.org/10.4239/wjd.v5.i1.1


