Copyright
©2013 Baishideng Publishing Group Co.
World J Diabetes. Dec 15, 2013; 4(6): 339-348
Published online Dec 15, 2013. doi: 10.4239/wjd.v4.i6.339
Published online Dec 15, 2013. doi: 10.4239/wjd.v4.i6.339
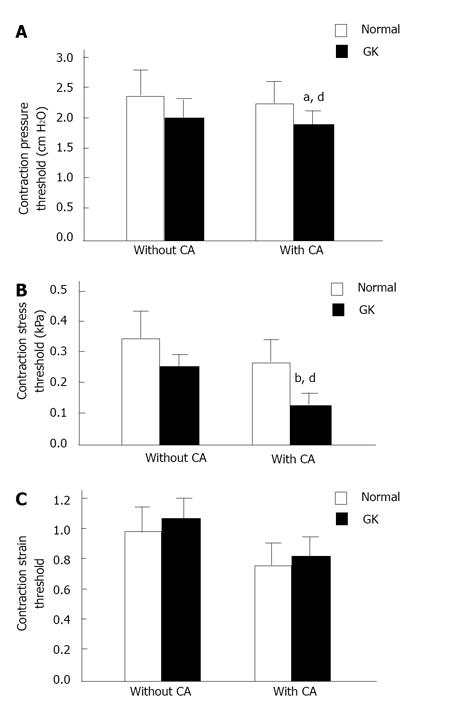
Figure 6 Contraction thresholds.
Illustration of the pressures (top), stresses (middle) and strains (bottom) at the contraction threshold in two different groups. The pressure and stress thresholds were significantly decreased in GK group after CA stimulation (compared with Normal group, pressure threshold, aP < 0.05; stress threshold, bP < 0.01). Furthermore, the pressure and stress thresholds were significantly decreased in GK group with CA application (compared with without CA, dP < 0.01) but not in Normal group (P > 0.05). The strain at the contraction threshold did not differ between two different groups (P > 0.05) and between before and after CA application (P > 0.05). CA: Carbachol; GK: Goto-Kakizaki.
- Citation: Zhao JB, Chen PM, Gregersen H. Changes of phasic and tonic smooth muscle function of jejunum in type 2 diabetic Goto-Kakizaki rats. World J Diabetes 2013; 4(6): 339-348
- URL: https://www.wjgnet.com/1948-9358/full/v4/i6/339.htm
- DOI: https://dx.doi.org/10.4239/wjd.v4.i6.339


