Copyright
©2013 Baishideng Publishing Group Co.
World J Diabetes. Dec 15, 2013; 4(6): 339-348
Published online Dec 15, 2013. doi: 10.4239/wjd.v4.i6.339
Published online Dec 15, 2013. doi: 10.4239/wjd.v4.i6.339
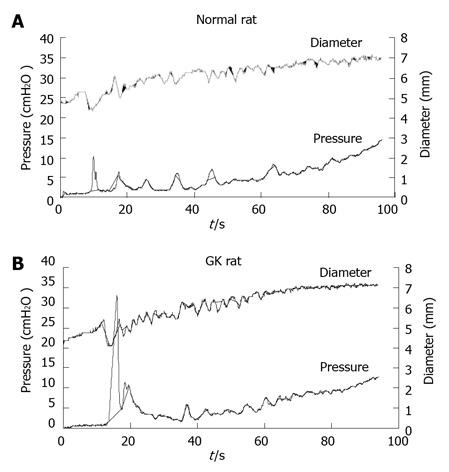
Figure 5 Pressure-diameter curves from normal and goto-Kakizaki groups.
Illustration of ramp distension curves of the pressure and diameter of jejunal segment with carbachol application obtained from a Normal (top) and a GK diabetic (bottom) rats. Higher peak of contraction was observed in the GK diabetic rat. CA: Carbachol; GK: Goto-Kakizaki.
- Citation: Zhao JB, Chen PM, Gregersen H. Changes of phasic and tonic smooth muscle function of jejunum in type 2 diabetic Goto-Kakizaki rats. World J Diabetes 2013; 4(6): 339-348
- URL: https://www.wjgnet.com/1948-9358/full/v4/i6/339.htm
- DOI: https://dx.doi.org/10.4239/wjd.v4.i6.339


