Copyright
©2013 Baishideng Publishing Group Co.
World J Diabetes. Dec 15, 2013; 4(6): 339-348
Published online Dec 15, 2013. doi: 10.4239/wjd.v4.i6.339
Published online Dec 15, 2013. doi: 10.4239/wjd.v4.i6.339
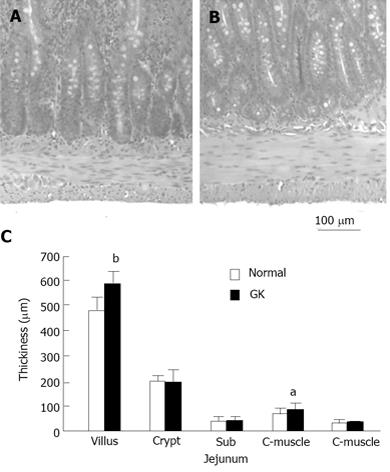
Figure 3 Histological dada.
The top figure illustrates the example of jejunal muscle layer in Normal (A) and GK (B) rats. The increasing muscle layer thickness was noted in GK diabetic rat. The bottom figure (C) shows the jejunal layer thickness in two different groups. The villous height and circumferential muscle layer thickness were significantly bigger in GK group (Compared with normal group: aP < 0.05, bP < 0.01). GK: Goto-Kakizaki.
- Citation: Zhao JB, Chen PM, Gregersen H. Changes of phasic and tonic smooth muscle function of jejunum in type 2 diabetic Goto-Kakizaki rats. World J Diabetes 2013; 4(6): 339-348
- URL: https://www.wjgnet.com/1948-9358/full/v4/i6/339.htm
- DOI: https://dx.doi.org/10.4239/wjd.v4.i6.339


