Copyright
©2013 Baishideng Publishing Group Co.
World J Diabetes. Dec 15, 2013; 4(6): 339-348
Published online Dec 15, 2013. doi: 10.4239/wjd.v4.i6.339
Published online Dec 15, 2013. doi: 10.4239/wjd.v4.i6.339
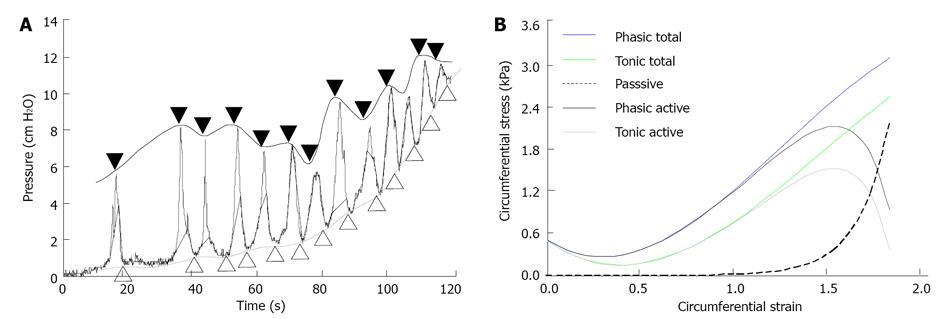
Figure 2 Pressure-diameter curve used for set-up maximum and baseline of contraction, and example of stress-strain curves.
A: Maximum amplitudes during contraction and the baseline between the contractions during distension. The closed symbols above the curve mark the phasic part (black line). The open symbols under the curve mark the tonic part (gray line). The pressures from the phasic and tonic parts were used to compute the total phasic and tonic stresses; B: An example of passive, total phasic, total tonic, phasic active and tonic active stresses as function of strains from a normal animal. The passive stress increased exponentially as function of strain, whereas the total phasic and tonic stresses increased in a polynomial way. The phasic and tonic active stresses were obtained by the total phasic and tonic stresses minus the passive stress.
- Citation: Zhao JB, Chen PM, Gregersen H. Changes of phasic and tonic smooth muscle function of jejunum in type 2 diabetic Goto-Kakizaki rats. World J Diabetes 2013; 4(6): 339-348
- URL: https://www.wjgnet.com/1948-9358/full/v4/i6/339.htm
- DOI: https://dx.doi.org/10.4239/wjd.v4.i6.339


