Copyright
©The Author(s) 2023.
World J Diabetes. Feb 15, 2023; 14(2): 120-129
Published online Feb 15, 2023. doi: 10.4239/wjd.v14.i2.120
Published online Feb 15, 2023. doi: 10.4239/wjd.v14.i2.120
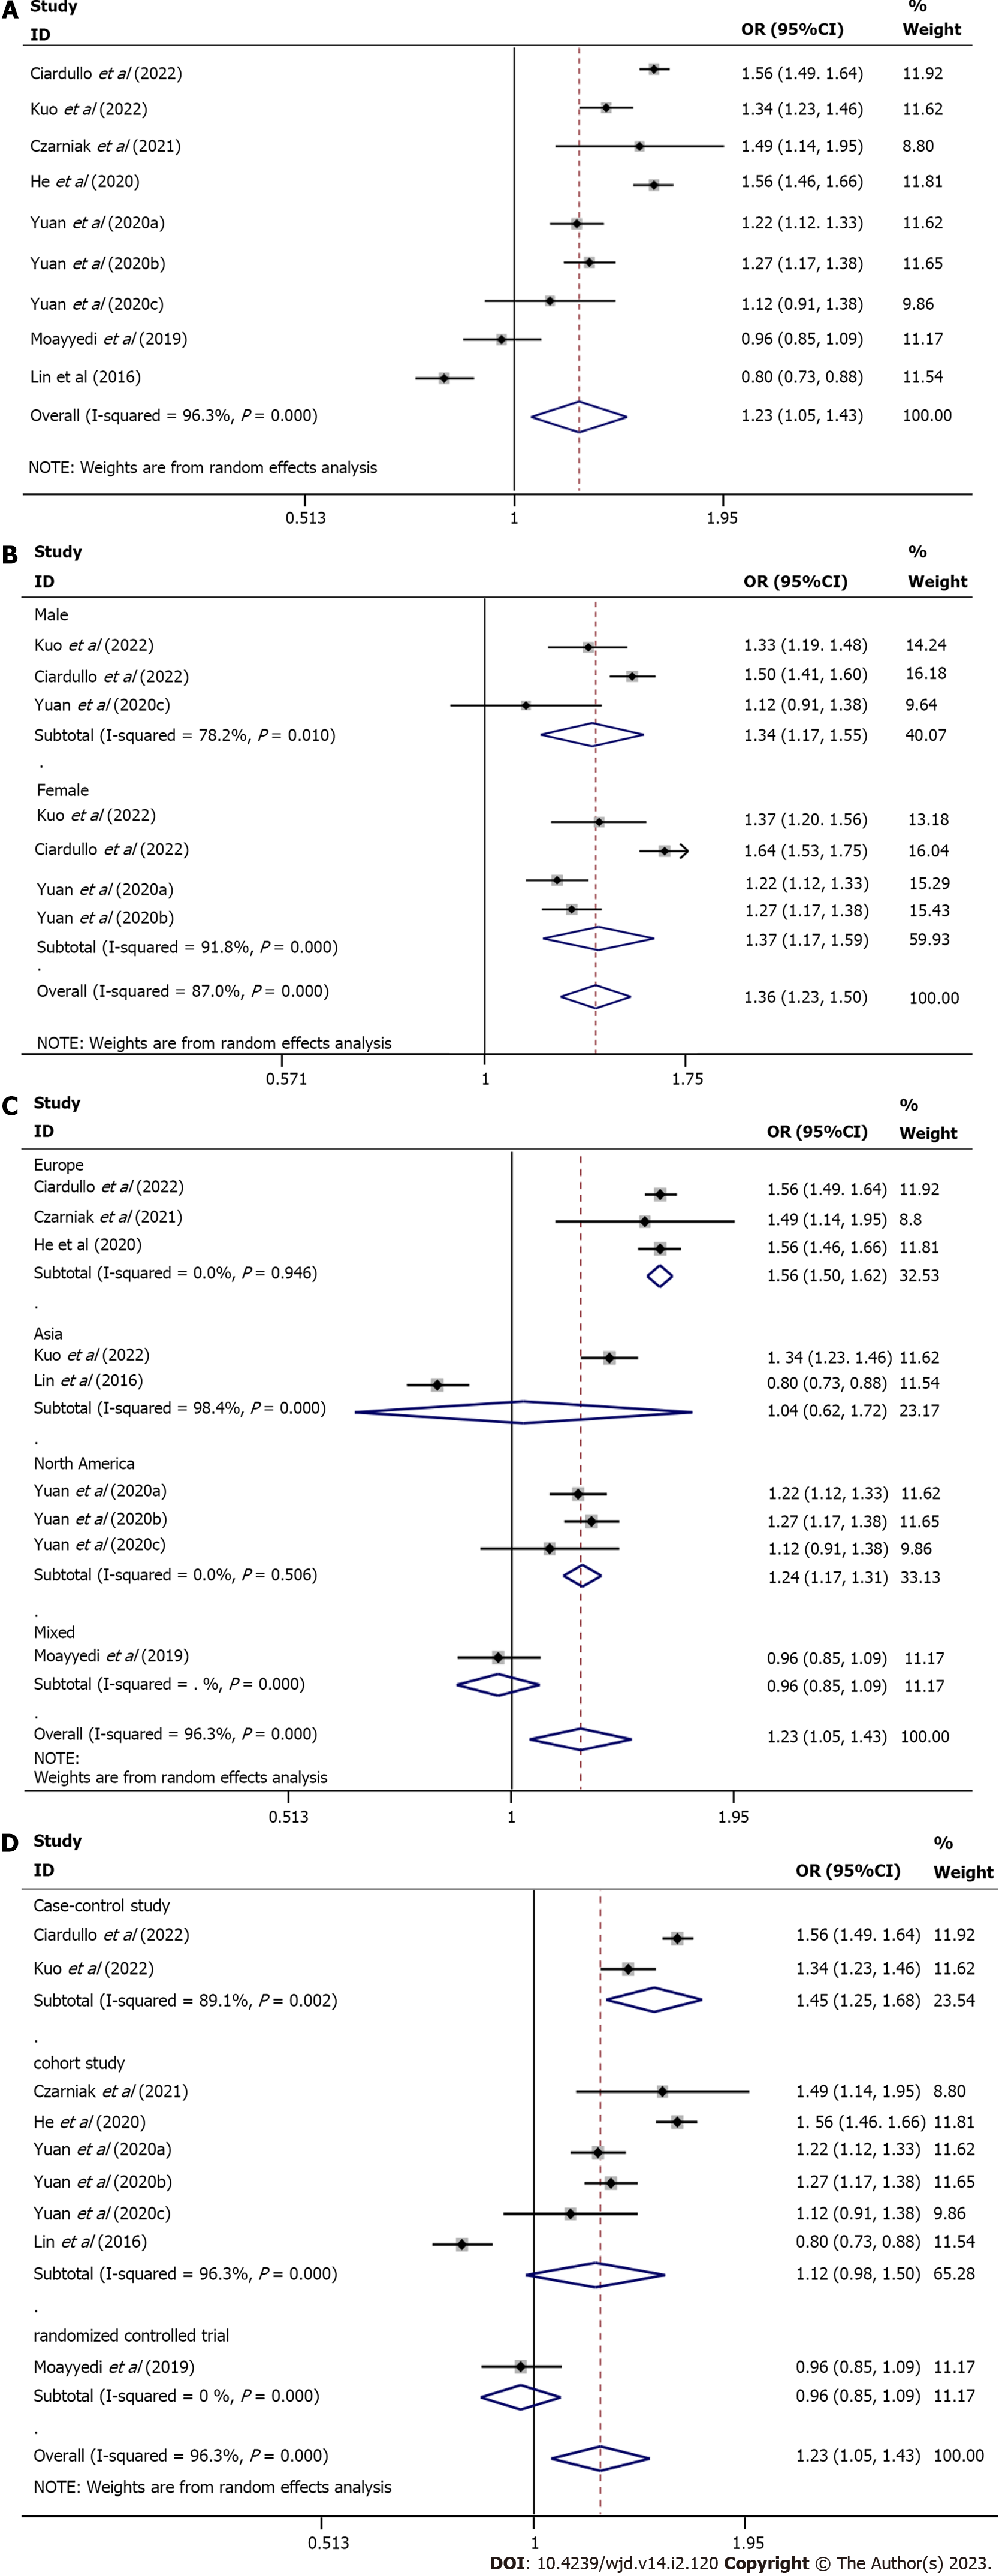
Figure 2 Forest plots.
A: Forest plot of the association between proton pump inhibitor use and diabetes risk; B: Forest plot of the association between proton pump inhibitor use and diabetes risk according to sex; C: Forest plot of the association between proton pump inhibitor use and diabetes risk according to geographic location; D: Forest plot of the association between proton pump inhibitor use and diabetes risk according to study design. CI: Confidence interval; OR: Odds ratio.
- Citation: Guo YR, Liu XM, Wang GX. Exposure to proton pump inhibitors and risk of diabetes: A systematic review and meta-analysis. World J Diabetes 2023; 14(2): 120-129
- URL: https://www.wjgnet.com/1948-9358/full/v14/i2/120.htm
- DOI: https://dx.doi.org/10.4239/wjd.v14.i2.120


