Copyright
©The Author(s) 2017.
World J Gastrointest Oncol. Mar 15, 2017; 9(3): 105-120
Published online Mar 15, 2017. doi: 10.4251/wjgo.v9.i3.105
Published online Mar 15, 2017. doi: 10.4251/wjgo.v9.i3.105
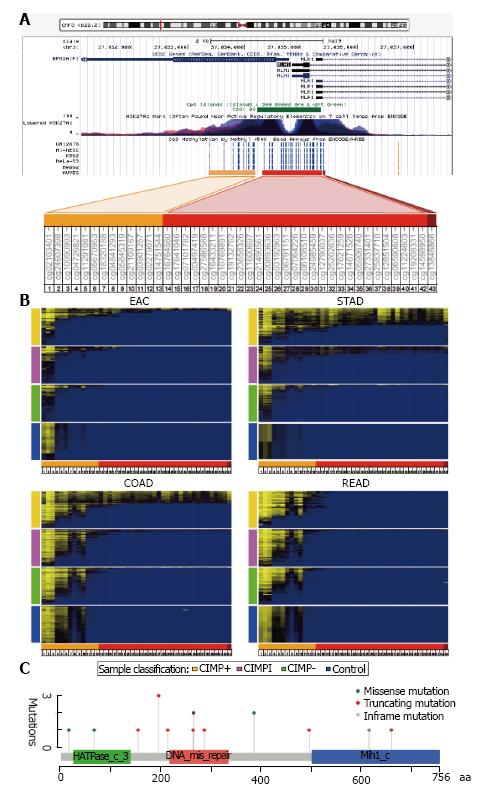
Figure 2 MLH1 promoter methylation and somatic mutations.
A: Diagram of the MLH1 promoter region and the adjacent gene, EPM2AIP1, obtained from the UCSC Human Genome Browser. The probes in this region from the Illumina Infinium HumanMethylation450 array are shown with color bars relative to the CpG island present at this locus: The north shore (orange), the CpG island (red), and the south shore (dark red); B: Heat maps of GIADs showing DNA methylation status across a large genomic region that encompasses the MLH1 promoter. Probes are displayed from left to right, and samples are ordered from top to bottom by average methylation across the region. Color side bars indicate CIMP status: CIMP+ (gold), CIMP intermediate (CIMPi; magenta), CIMP- (green), and control tissue (blue); C: Distribution of 16 somatic mutations in the coding region of MLH1. Color boxes correspond to different functional domains, as specified in the cBioPortal at MSKCC[99], and the vertical axis shows the number of mutations affecting a given codon. GIADs: Gastrointestinal adenocarcinomas; CIMP: CpG island methylator phenotype.
- Citation: Sánchez-Vega F, Gotea V, Chen YC, Elnitski L. CpG island methylator phenotype in adenocarcinomas from the digestive tract: Methods, conclusions, and controversies. World J Gastrointest Oncol 2017; 9(3): 105-120
- URL: https://www.wjgnet.com/1948-5204/full/v9/i3/105.htm
- DOI: https://dx.doi.org/10.4251/wjgo.v9.i3.105


