Copyright
©2010 Baishideng.
World J Gastrointest Oncol. Jan 15, 2010; 2(1): 19-30
Published online Jan 15, 2010. doi: 10.4251/wjgo.v2.i1.19
Published online Jan 15, 2010. doi: 10.4251/wjgo.v2.i1.19
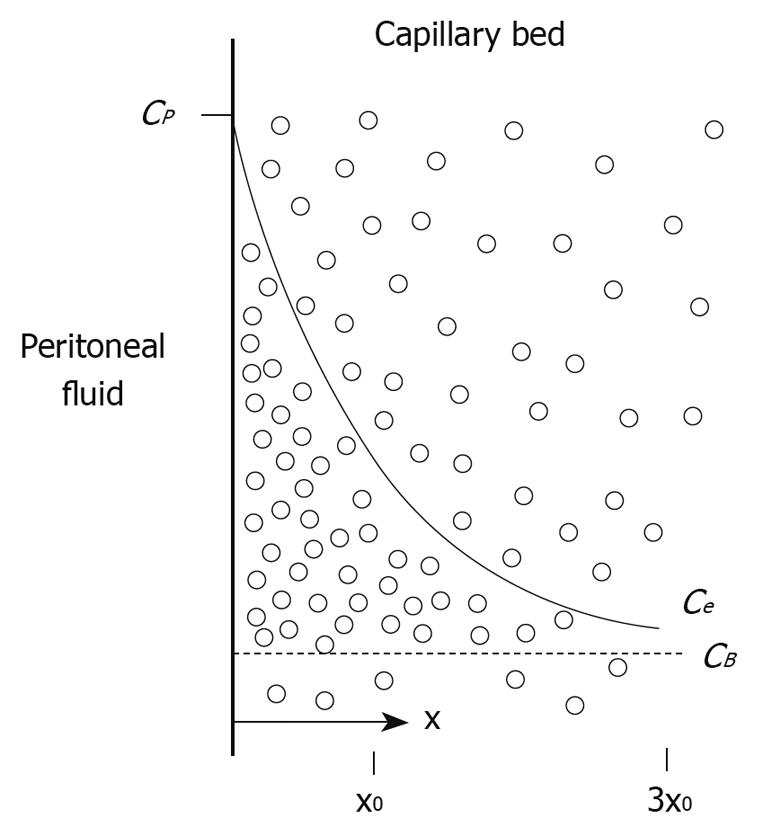
Figure 3 Conceptual diagram of tissue adjacent to the peritoneal cavity.
Cp = the free drug concentration in the peritoneal fluid; CB = the free drug concentration in the blood (or plasma). Solid line shows the exponential decrease in the free tissue interstitial concentration, Ce, as the drug diffuses down the concentration gradient and is removed by loss to the blood perfusing the tissue. Also shown are the characteristic diffusion length, x0, at which the concentration difference between the tissue and the blood has decreased to 37% of its maximum value, and 3x0, at which the difference has decreased to 5% of its maximum value[36].
- Citation: Sugarbaker PH, Van der Speeten K, Stuart OA. Pharmacologic rationale for treatments of peritoneal surface malignancy from colorectal cancer. World J Gastrointest Oncol 2010; 2(1): 19-30
- URL: https://www.wjgnet.com/1948-5204/full/v2/i1/19.htm
- DOI: https://dx.doi.org/10.4251/wjgo.v2.i1.19


