Copyright
©The Author(s) 2016.
World J Gastrointest Endosc. Aug 10, 2016; 8(15): 517-532
Published online Aug 10, 2016. doi: 10.4253/wjge.v8.i15.517
Published online Aug 10, 2016. doi: 10.4253/wjge.v8.i15.517
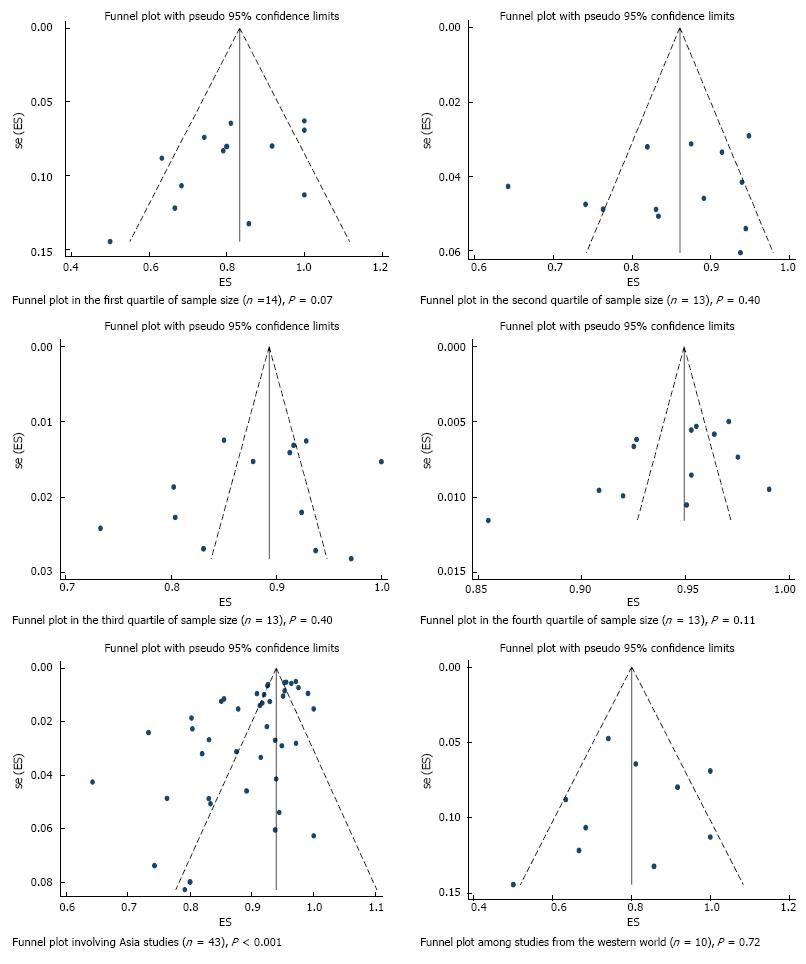
Figure 6 Funnel plot of histologically confirmed en bloc (R0) resection rate in 53 studies involving 18017 tumors in 16472 patients that underwent gastric endoscopic submucosal dissection, stratified based on sources of heterogeneity.
Each dot represents the R0 resection rate. Lack of asymmetry in the funnel plot within quartile of study precision (calculated as inverse of standard error) indicates that the asymmetry in the overall plot (Figure 4) is most likely due to true heterogeneity by sample size rather than a publication bias. P values were calculated based on egger’s test. ES: Estimate; se (ES): Standard error of estimate.
- Citation: Akintoye E, Obaitan I, Muthusamy A, Akanbi O, Olusunmade M, Levine D. Endoscopic submucosal dissection of gastric tumors: A systematic review and meta-analysis. World J Gastrointest Endosc 2016; 8(15): 517-532
- URL: https://www.wjgnet.com/1948-5190/full/v8/i15/517.htm
- DOI: https://dx.doi.org/10.4253/wjge.v8.i15.517


