Copyright
©2013 Baishideng Publishing Group Co.
World J Gastrointest Endosc. Nov 16, 2013; 5(11): 534-539
Published online Nov 16, 2013. doi: 10.4253/wjge.v5.i11.534
Published online Nov 16, 2013. doi: 10.4253/wjge.v5.i11.534
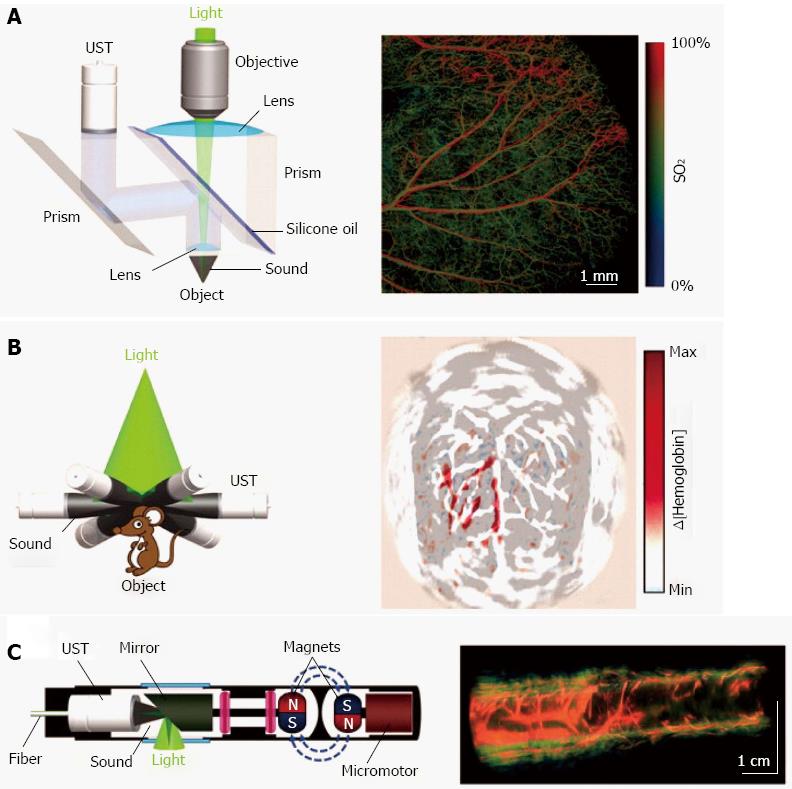
Figure 2 Three major implementations of photoacoustic tomography, with representative in vivo images.
A: Optical-resolution photoacoustic microscopy and an image of hemoglobin oxygen saturation (SO2) in a mouse ear; B: Circular-array photoacoustic computed tomography and an image of cerebral hemodynamic changes, ∆[hemoglobin], in response to one-sided whisker stimulation in a rat; C: Photoacoustic endoscopy and an image of a rabbit esophagus and adjacent internal organs, including the trachea and lung. Reproduced with permission from Wang et al[5]. SO2: Oxygen saturation; UST: Ultrasonic transducer.
- Citation: Yoon TJ, Cho YS. Recent advances in photoacoustic endoscopy. World J Gastrointest Endosc 2013; 5(11): 534-539
- URL: https://www.wjgnet.com/1948-5190/full/v5/i11/534.htm
- DOI: https://dx.doi.org/10.4253/wjge.v5.i11.534


