Copyright
©The Author(s) 2023.
World J Gastrointest Endosc. Mar 16, 2023; 15(3): 84-102
Published online Mar 16, 2023. doi: 10.4253/wjge.v15.i3.84
Published online Mar 16, 2023. doi: 10.4253/wjge.v15.i3.84
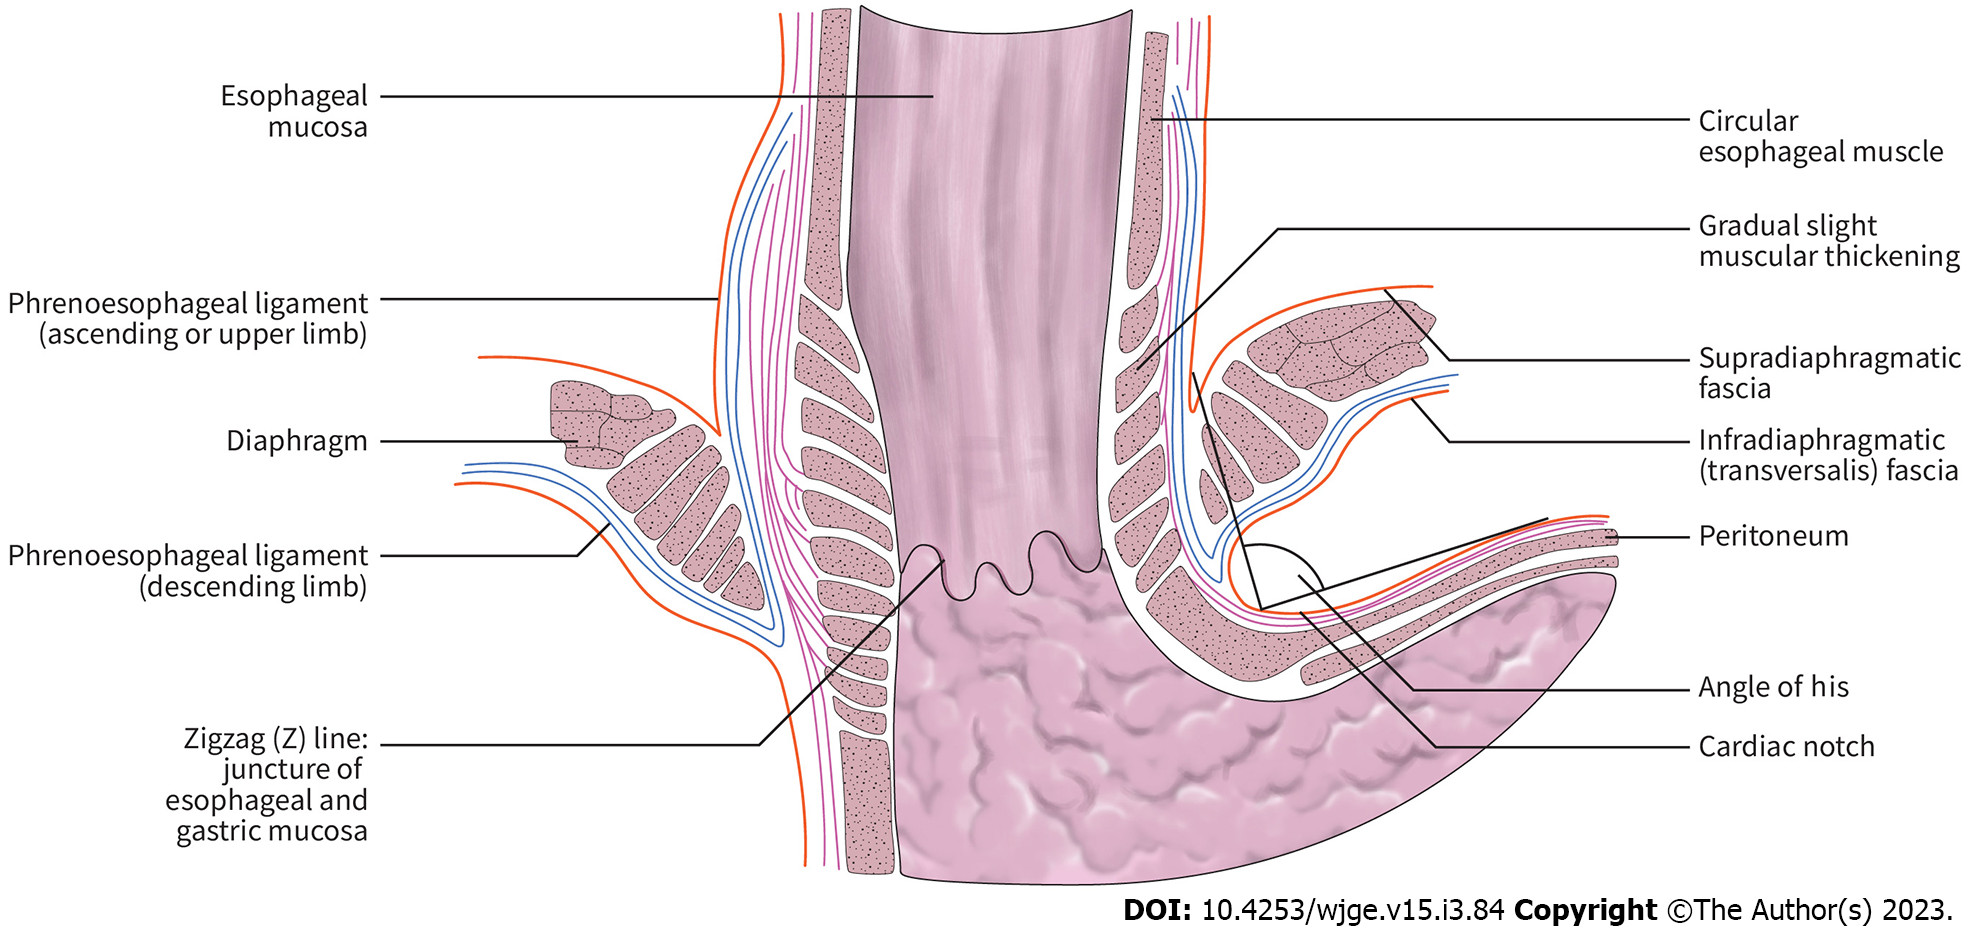
Figure 1 The anatomical antireflux barrier of the esophagus.
Figure 2 Characteristics of dental erosion in a child with corrected esophageal atresia compared to dental caries in a healthy child.
A: Characteristics of dental erosion on the occlusal and palatal surface of deciduous teeth; B: Characteristics of dental caries on deciduous teeth.
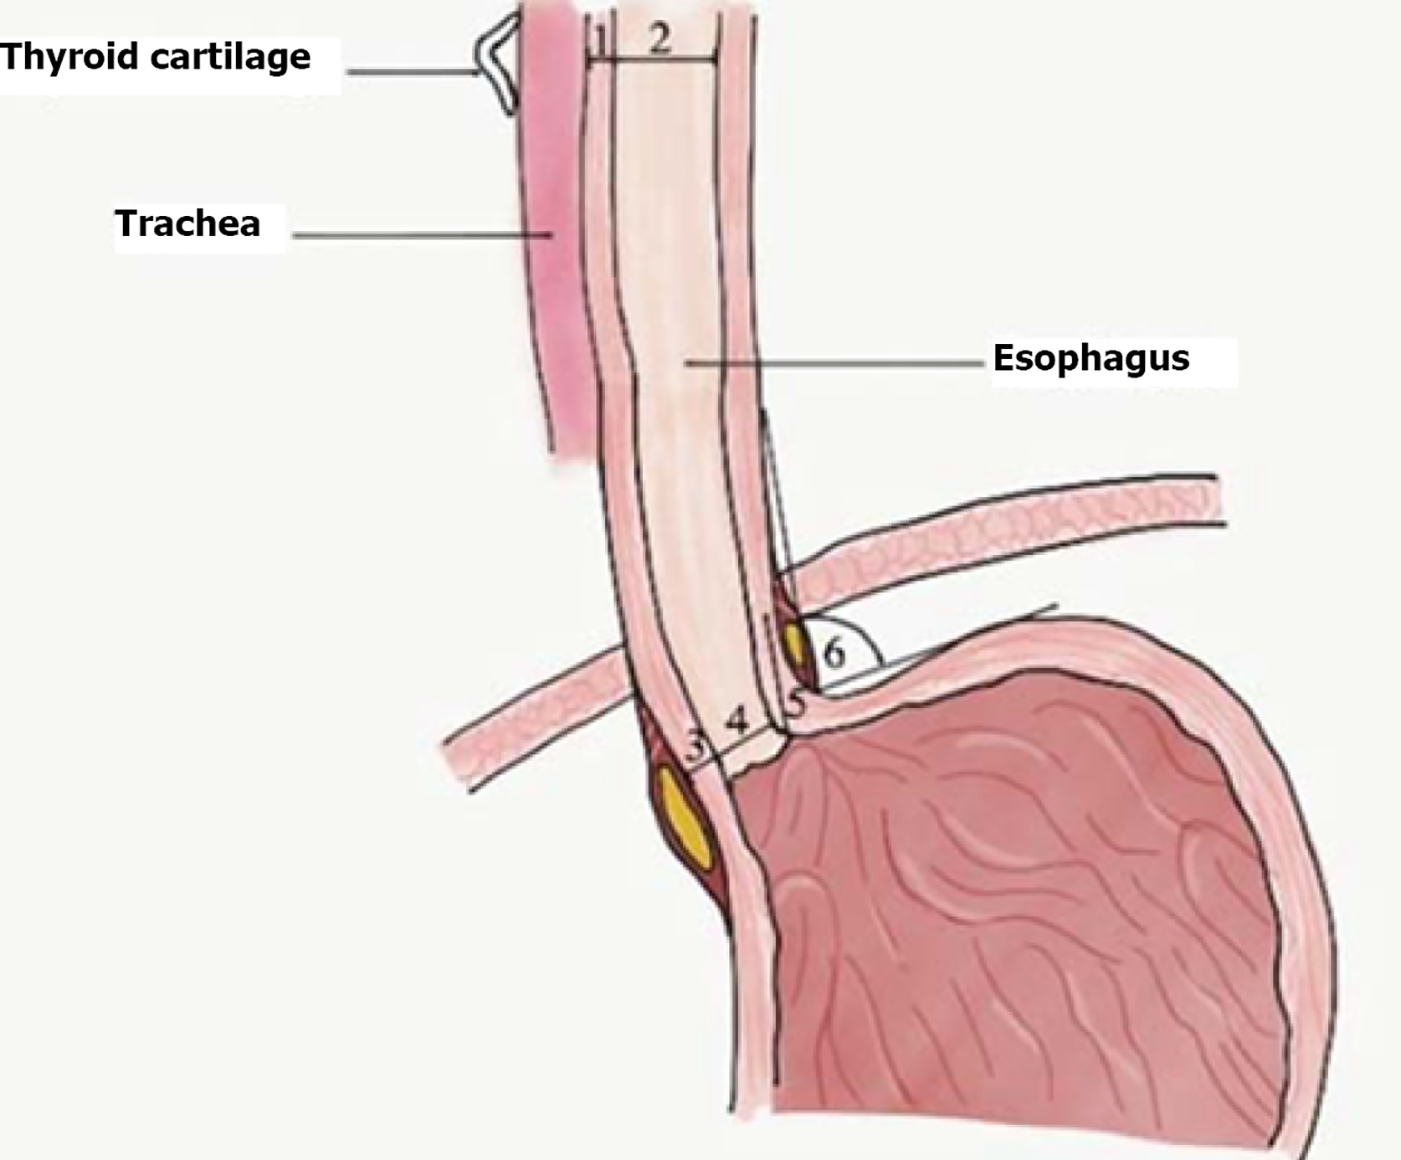
Figure 3 Landmarks of the esophagus and stomach measured by ultrasonography in the study of Charoenwat et al[44].
1: Cervical esophageal thickness; 2: Cervical esophageal diameter; 3: Abdominal esophageal thickness; 4: Abdominal esophageal diameter; 5: Abdominal esophageal length; 6: Angle of His. Citation: Charoenwat B, Sintusek P, Chaijitraruch N, Mahayosnond A, Suksri S, Patcharatrakul T, Chongsrisawat V. Transcutaneous esophageal ultrasonography in children with suspected gastroesophageal reflux disease. J Med Asso Thai 2018; 101: S1-S745[44]. Copyright ©The Authors 2018. Published by Medical Association of Thailand. The authors have obtained the permission for Medical Association of Thailand (Supplementary material).
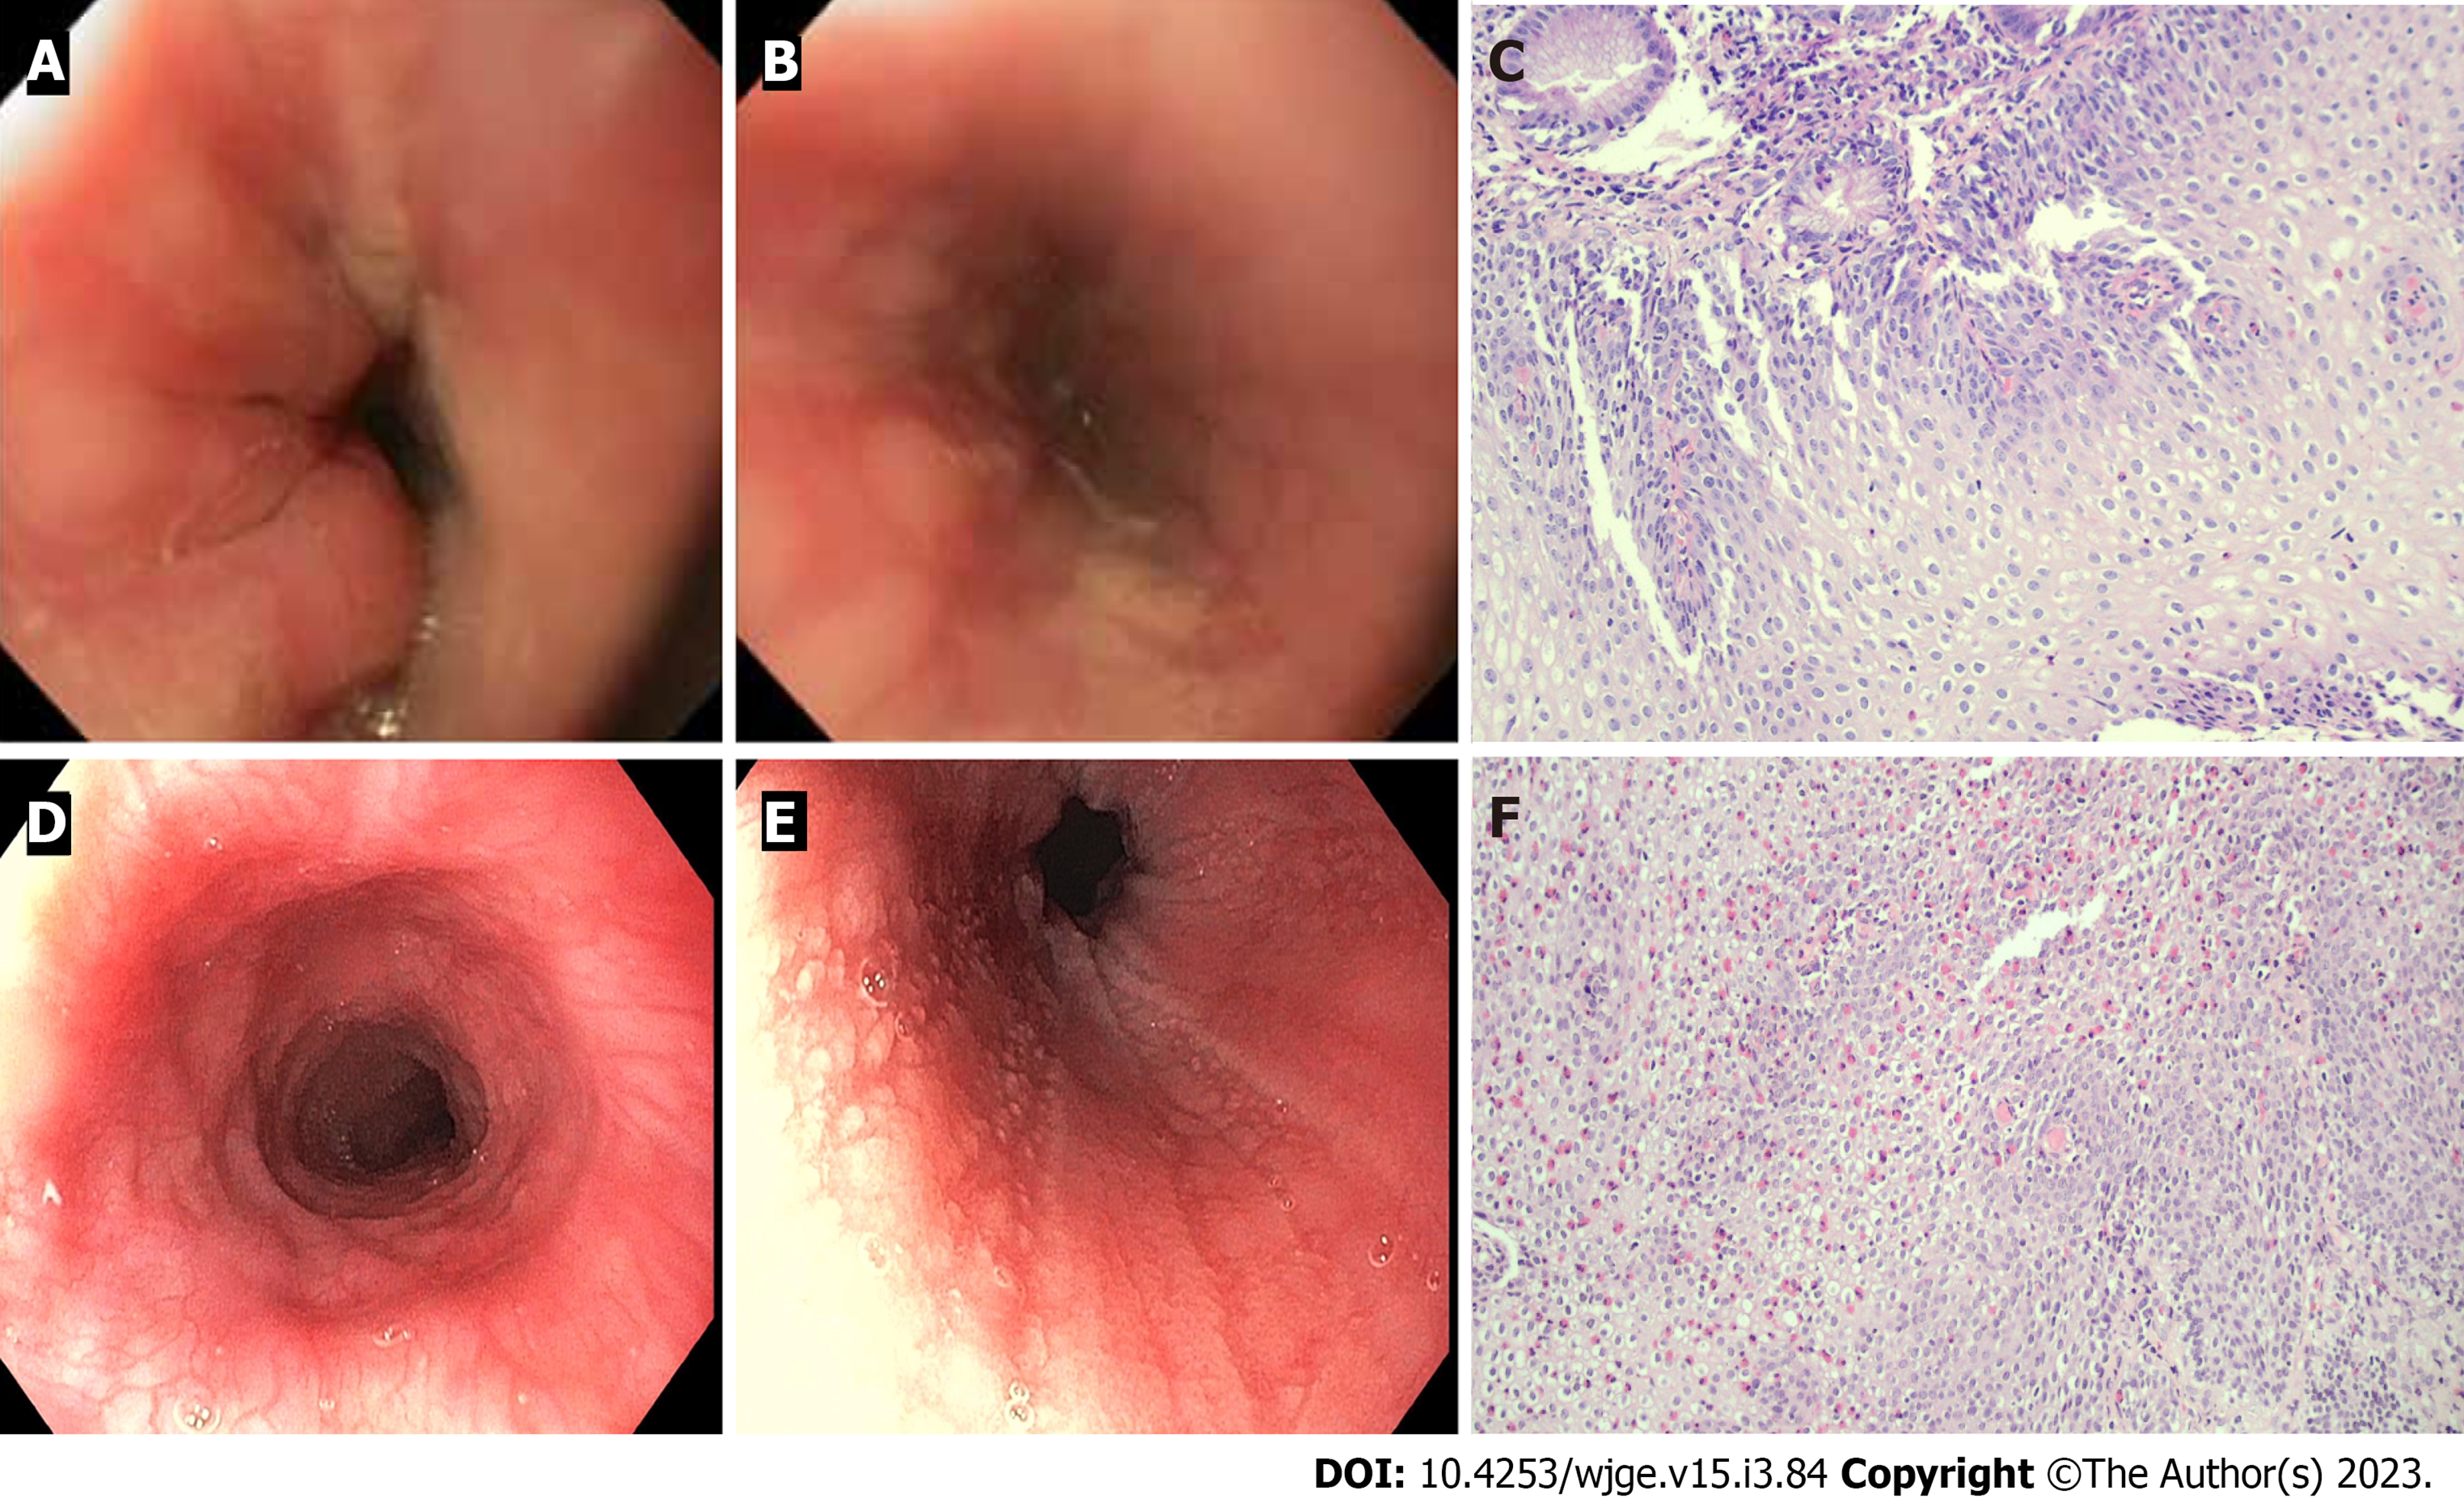
Figure 4 The endoscopic and histologic findings of reflux esophagitis and eosinophilic esophagitis.
A and B : Endoscopic finding of reflux esophagitis shows mucosal breaks and healing mucosal damage; C: Histopathology section (× 20) showing basal cell hyperplasia, elongation of the lamina propria papillae and scattered eosinophilic infiltration; D and E: Endoscopic findings of eosinophilic esophagitis showing ringed esophagus, linear furrows and whitish papules; F: Histopathology section (× 20) showing numerous eosinophils diffusely infiltrating the squamous epithelium (peak eosinophilic count = 40 cells/HPF). The squamous epithelium reveals spongiosis. Eosinophilic microabscesses and eosinophil degranulation are also noted.
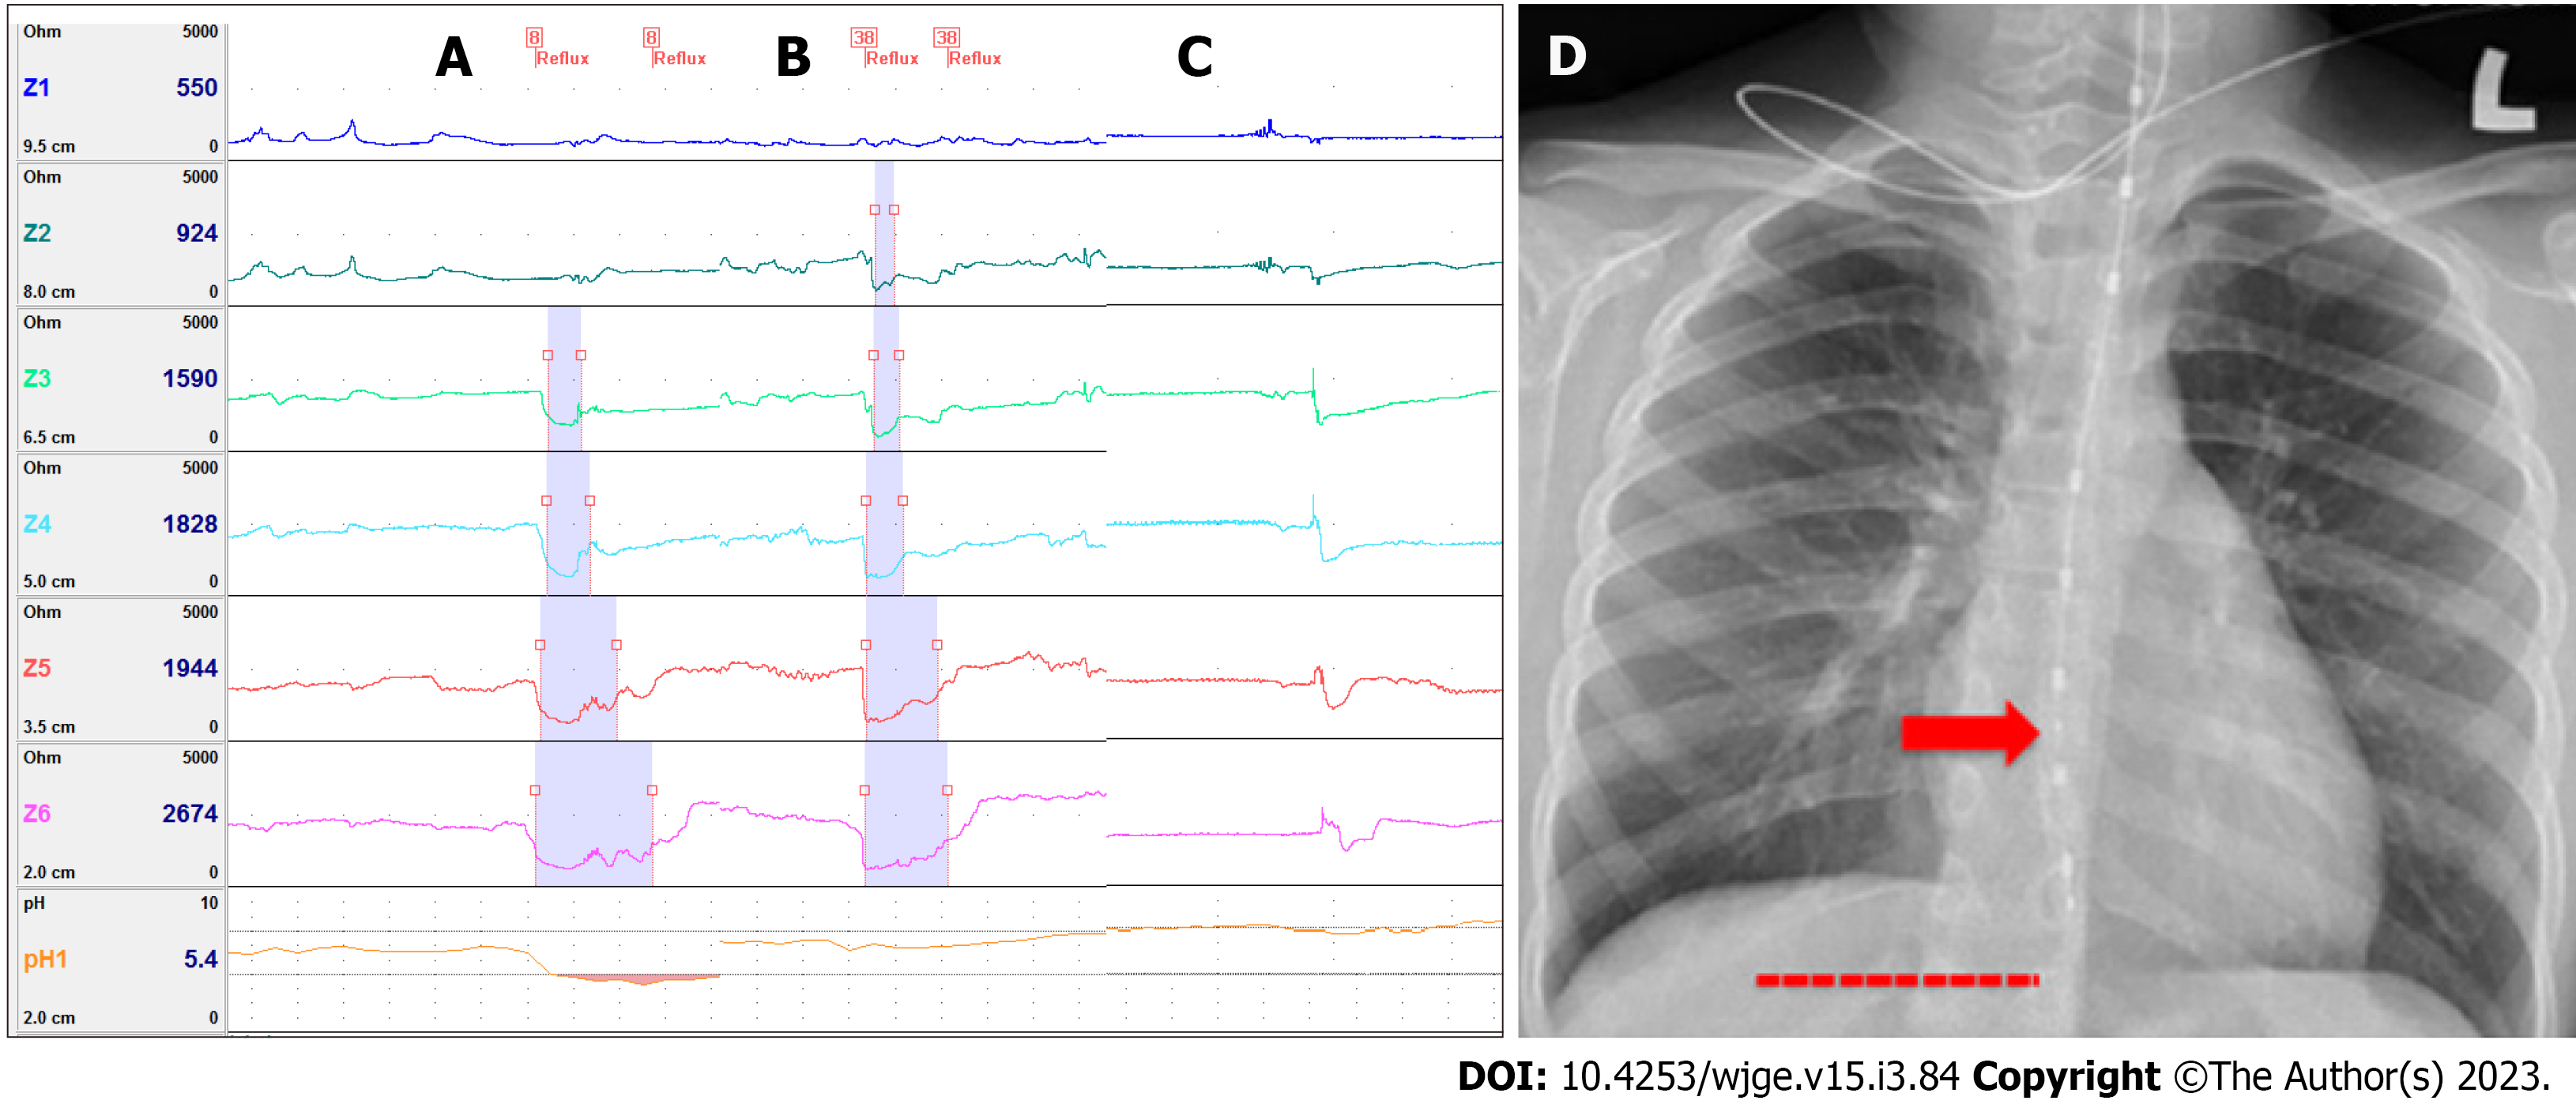
Figure 5 Tracing from MII-pH study and correct position of MII-pH probe on chest radiography.
A: Acid reflux (impedance changes up to 7.5 cm above the pH sensor, which shows a drop in pH); B: Non-acid reflux (impedance changes up to 9 cm above the pH sensor, without a pH drop); C: Swallow shown by impedance changes; D: Chest X-ray showing proper position of the pH sensor (arrow) of the MII-pH probe 2 vertebral bodies above the diaphragm (dotted line).
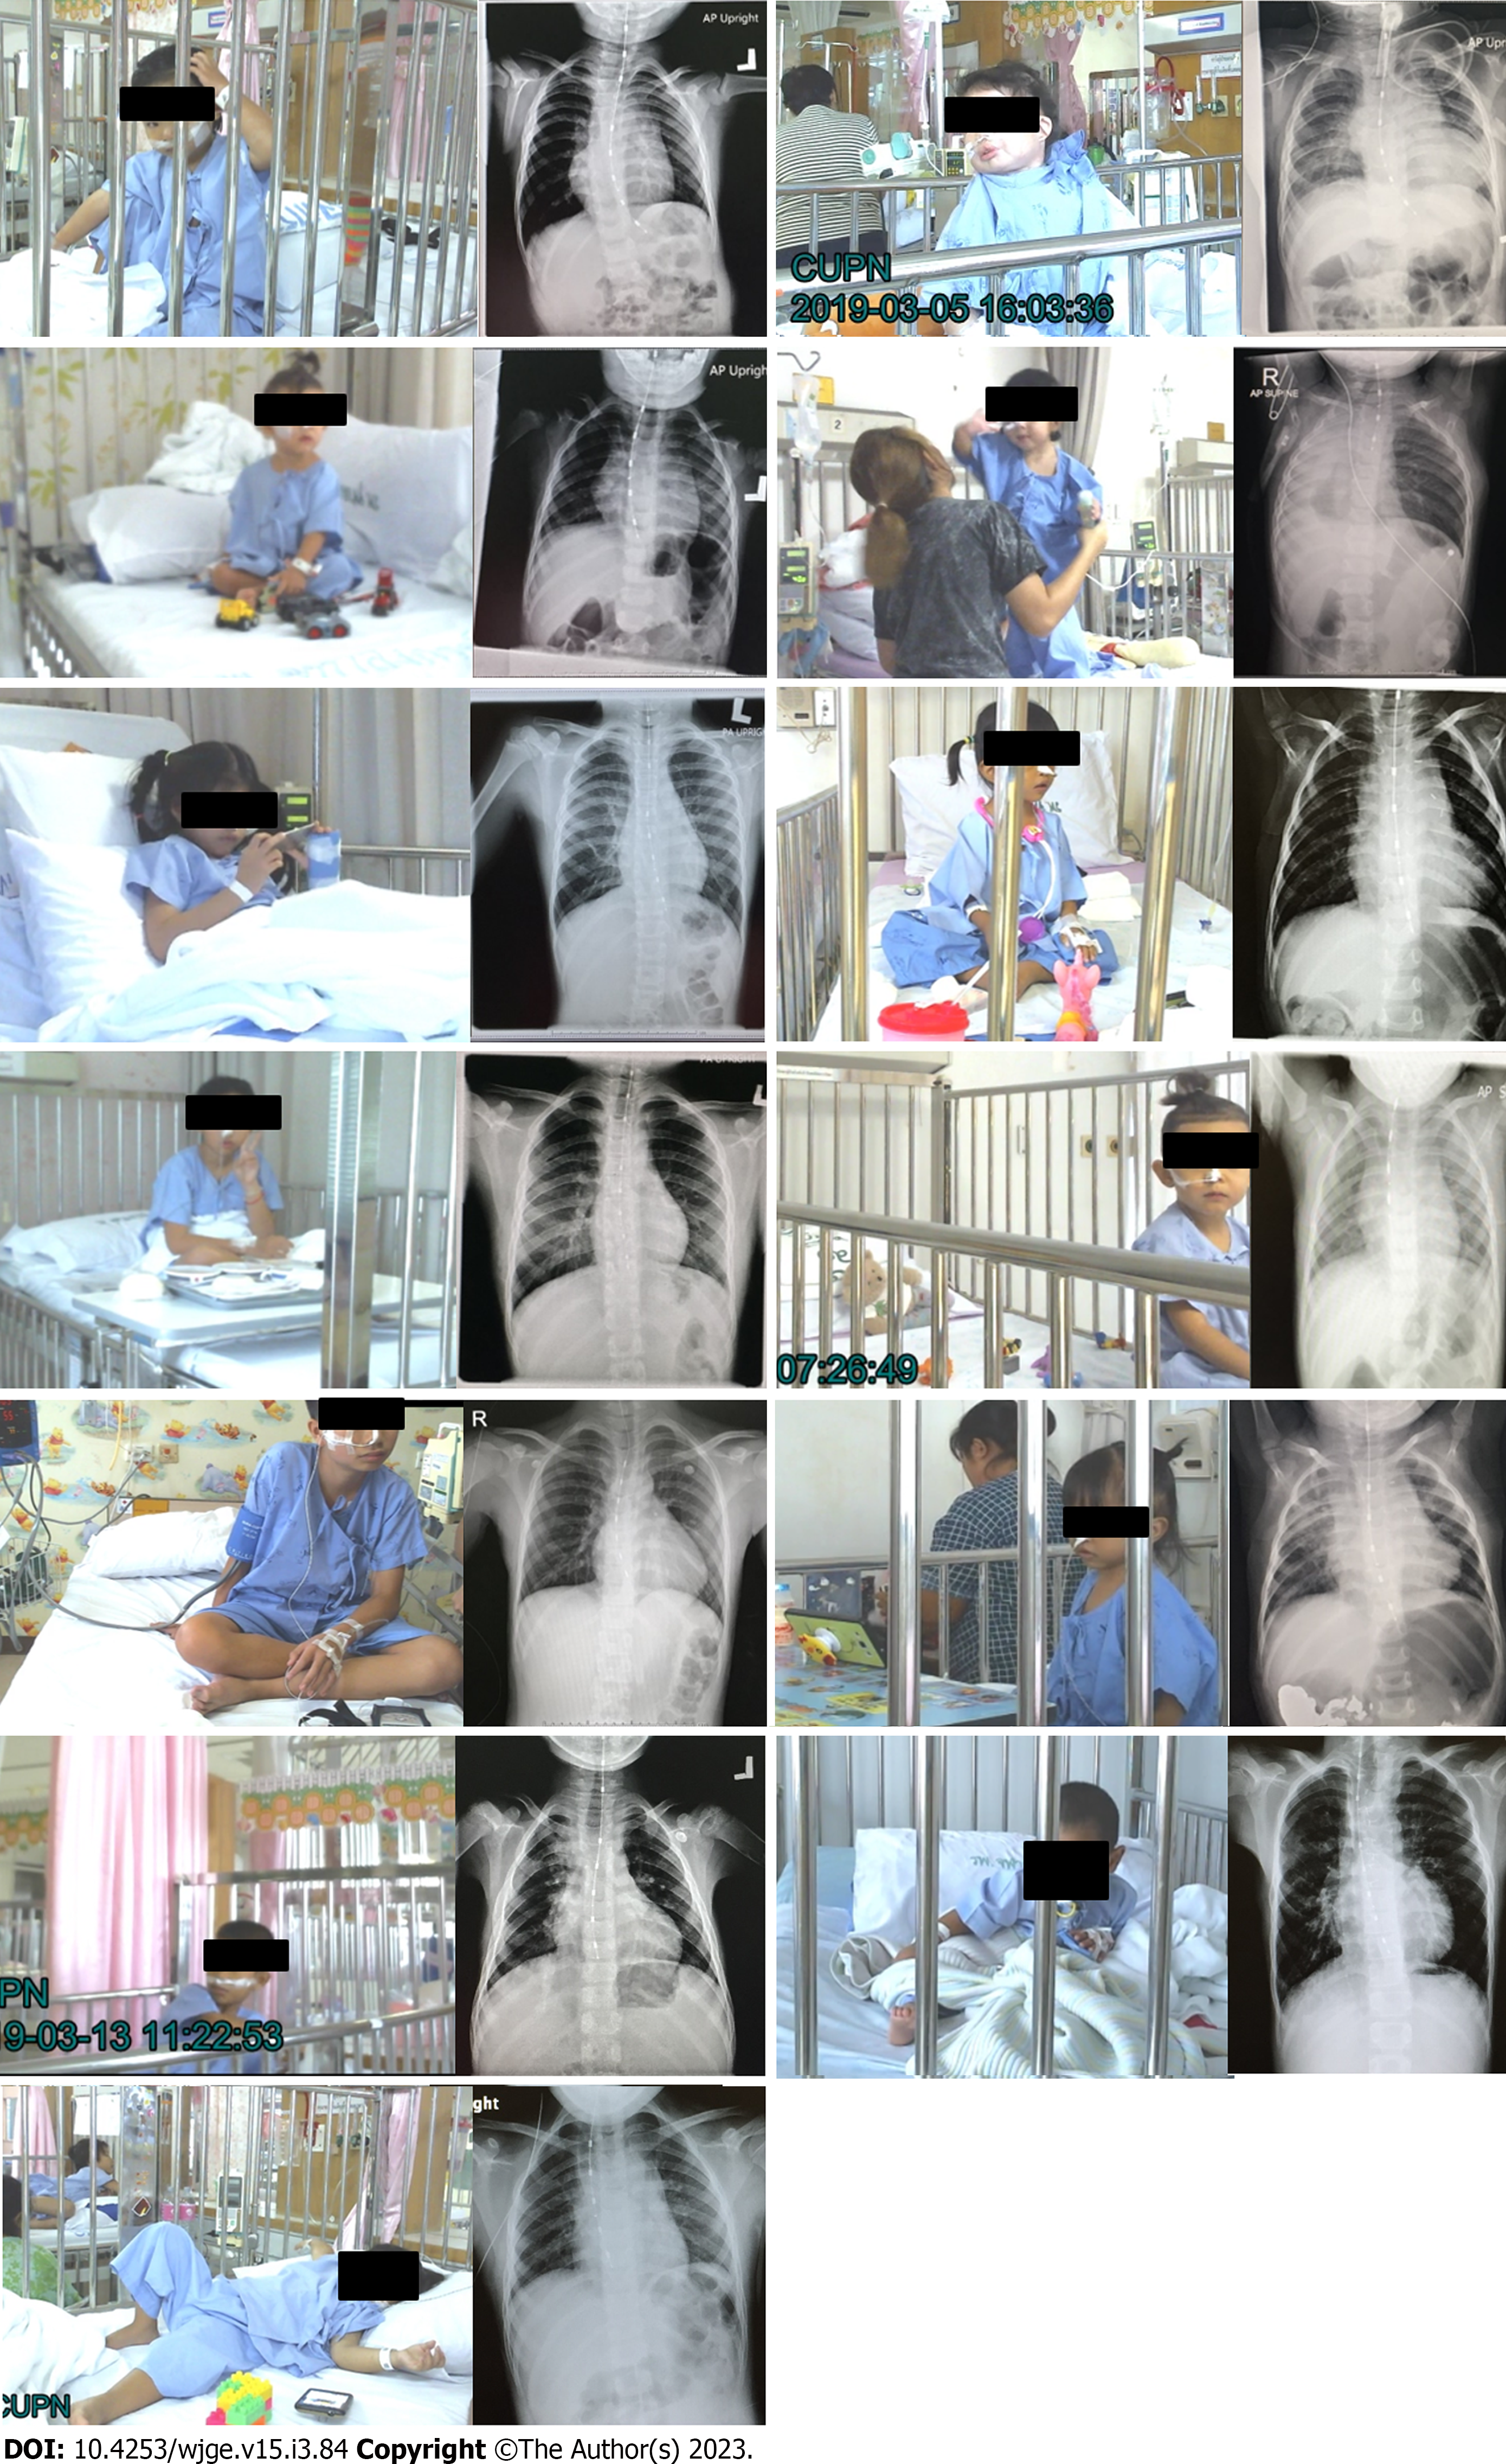
Figure 6 Children after corrected esophageal atresia who underwent Video-MII-pH monitoring.
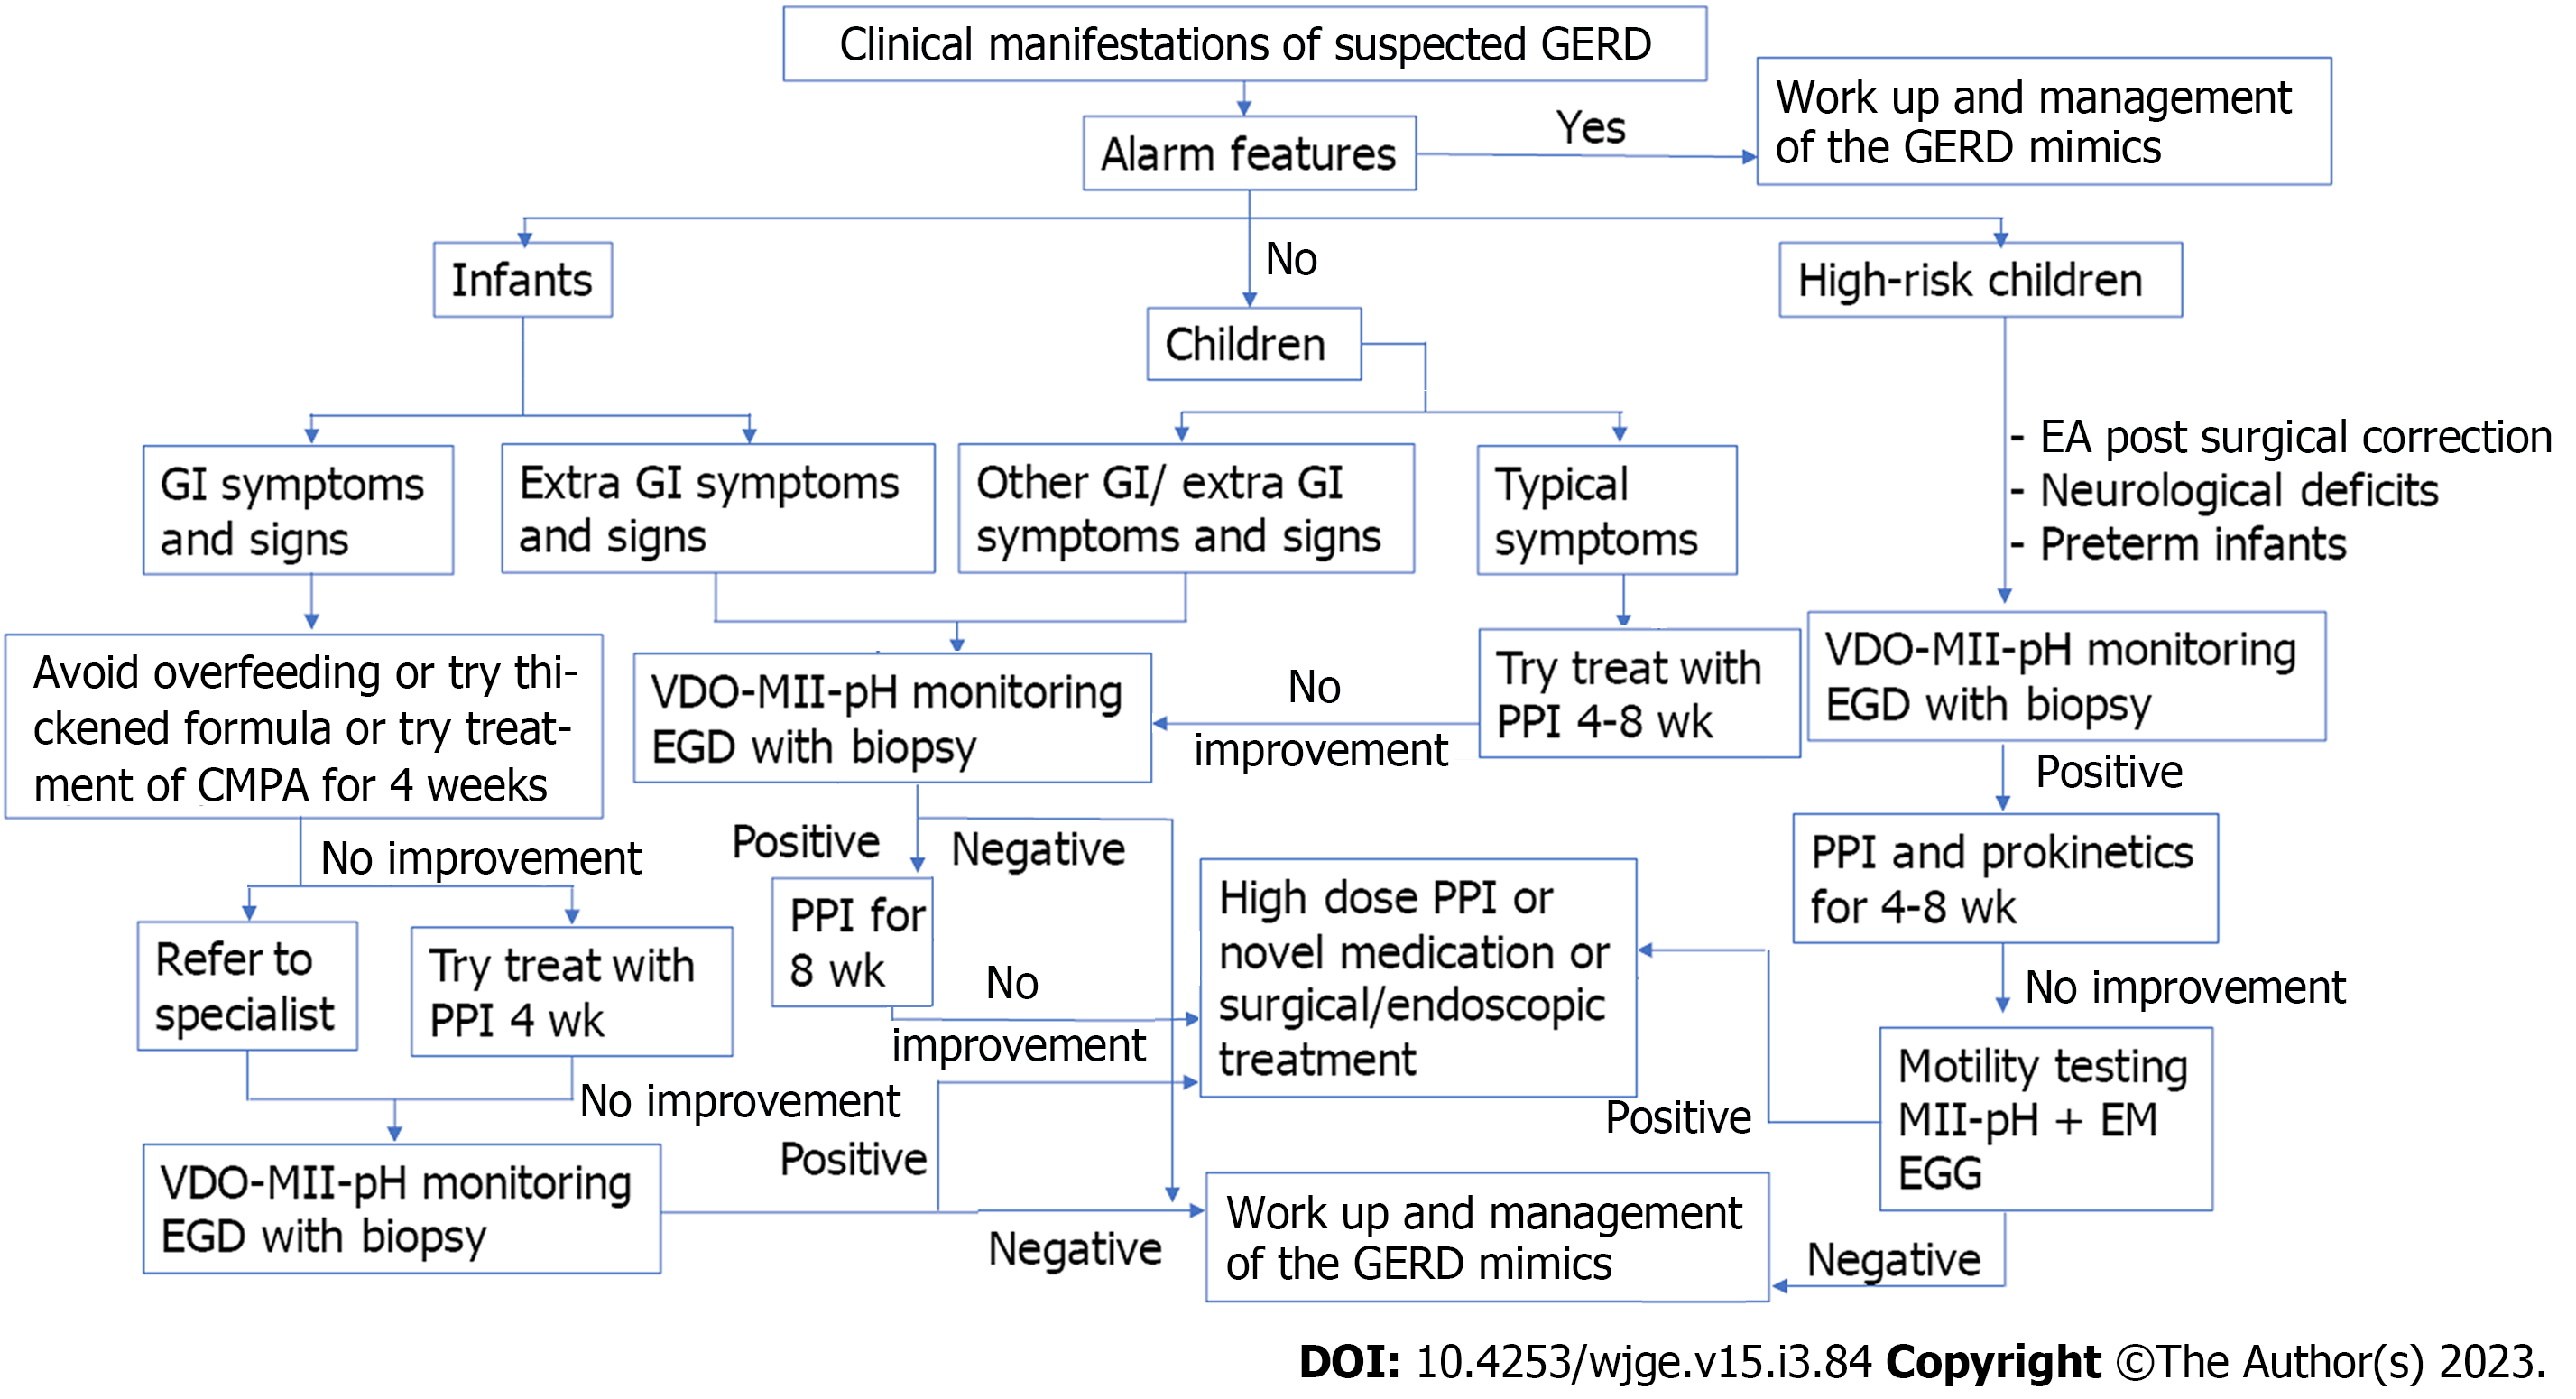
Figure 7 Proposed steps in the diagnosis and management of children with suspected GERD.
GERD: Gastroesophageal reflux disease; PPI: Proton pump inhibitor; EGG: Electrogastrography; GI: Gastrointestinal; EGD: Esophagogastroduodenoscopy; EM: Esophageal manometry; EA: Esophageal atresia; MII-Ph: Multichannel intraluminal impedance-pH study.
- Citation: Sintusek P, Mutalib M, Thapar N. Gastroesophageal reflux disease in children: What’s new right now? World J Gastrointest Endosc 2023; 15(3): 84-102
- URL: https://www.wjgnet.com/1948-5190/full/v15/i3/84.htm
- DOI: https://dx.doi.org/10.4253/wjge.v15.i3.84


