Copyright
©The Author(s) 2016.
World J Hepatol. Dec 28, 2016; 8(36): 1629-1636
Published online Dec 28, 2016. doi: 10.4254/wjh.v8.i36.1629
Published online Dec 28, 2016. doi: 10.4254/wjh.v8.i36.1629
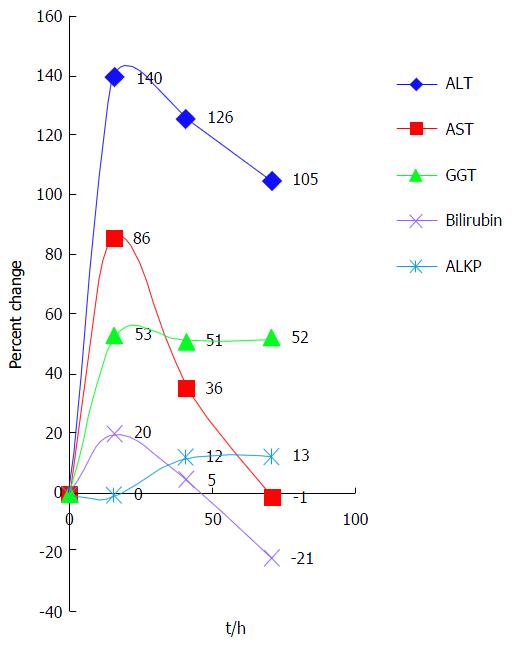
Figure 4 Time trends in percent changes of bilirubin and liver enzymes with serial testing.
Time between tests is represented using the average time interval between tests (as seen in Figure 2). The hourly percent change between each test was multiplied by this interval, to provide a graphic presentation of the enzyme patterns. The intersection of the axes represents the first test and the following points represent each change from the previous result. For example, bilirubin increased by 20% between tests one and two and decreased by 15% between tests two and three; therefore, the next point is 5%. ALT: Alanine aminotransferase; AST: Aspartate aminotransferase; GGT: Gamma-glutamyl transferase; ALKP: Alkaline phosphatase.
- Citation: Resnick E, Shteingart S, Melamud B, Bdolah-Abram T, Zalut T, Reuben A, Lurie Y. Enzyme pattern of biliary colic: A counterintuitive picture. World J Hepatol 2016; 8(36): 1629-1636
- URL: https://www.wjgnet.com/1948-5182/full/v8/i36/1629.htm
- DOI: https://dx.doi.org/10.4254/wjh.v8.i36.1629


