Copyright
©The Author(s) 2015.
World J Hepatol. Nov 18, 2015; 7(26): 2664-2675
Published online Nov 18, 2015. doi: 10.4254/wjh.v7.i26.2664
Published online Nov 18, 2015. doi: 10.4254/wjh.v7.i26.2664
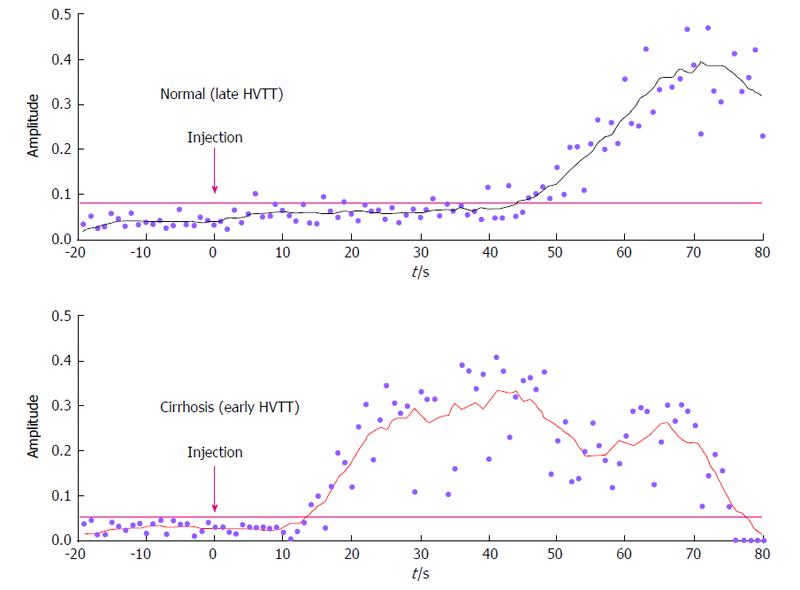
Figure 2 Hepatic vascular transit times.
Time intensity curves from the hepatic vein plotted in a normal patient and a patient with cirrhosis, showing earlier arrival of contrast in the cirrhotic liver. Adapted from Lim et al[22] 2005. HVTT: Hepatic vascular transit times.
- Citation: Trovato FM, Tognarelli JM, Crossey MM, Catalano D, Taylor-Robinson SD, Trovato GM. Challenges of liver cancer: Future emerging tools in imaging and urinary biomarkers. World J Hepatol 2015; 7(26): 2664-2675
- URL: https://www.wjgnet.com/1948-5182/full/v7/i26/2664.htm
- DOI: https://dx.doi.org/10.4254/wjh.v7.i26.2664


