Copyright
©The Author(s) 2015.
World J Hepatol. Jun 28, 2015; 7(12): 1632-1651
Published online Jun 28, 2015. doi: 10.4254/wjh.v7.i12.1632
Published online Jun 28, 2015. doi: 10.4254/wjh.v7.i12.1632
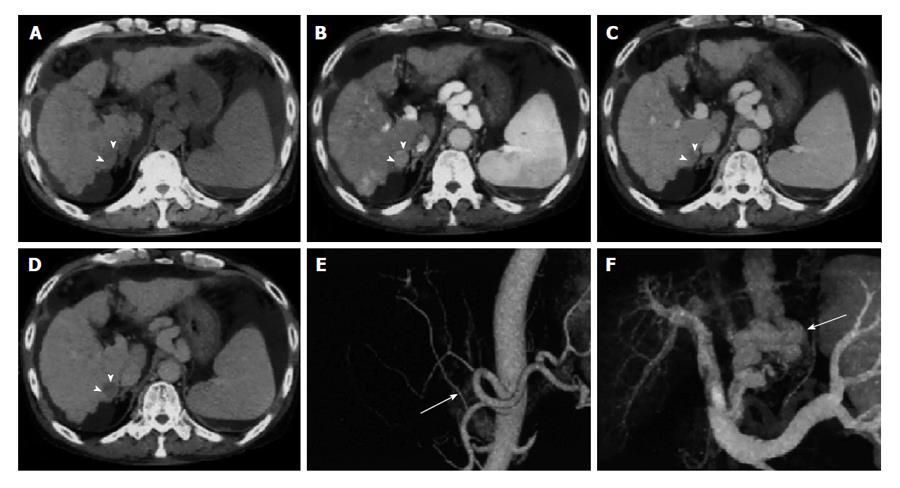
Figure 4 Multi-detector computed tomography of hepatocellular carcinoma.
A: Pre-contrast; B: Late arterial phase; C: Portal venous phase; D: Equilibrium phase dynamic multi-detector computed tomography images. The hepatocellular carcinoma (arrowheads) is visualised as an enhanced nodule in the late arterial phase and as a hypo-attenuated nodule in the equilibrium phase; E: Three-dimensional computed tomography angiography of hepatic arteries shows that the right hepatic artery branches (arrow in E) from the superior mesenteric artery; F: The portal venous system with creation of varices (arrow)[66].
- Citation: Attwa MH, El-Etreby SA. Guide for diagnosis and treatment of hepatocellular carcinoma. World J Hepatol 2015; 7(12): 1632-1651
- URL: https://www.wjgnet.com/1948-5182/full/v7/i12/1632.htm
- DOI: https://dx.doi.org/10.4254/wjh.v7.i12.1632


