Copyright
©The Author(s) 2024.
World J Hepatol. Aug 27, 2024; 16(8): 1177-1184
Published online Aug 27, 2024. doi: 10.4254/wjh.v16.i8.1177
Published online Aug 27, 2024. doi: 10.4254/wjh.v16.i8.1177
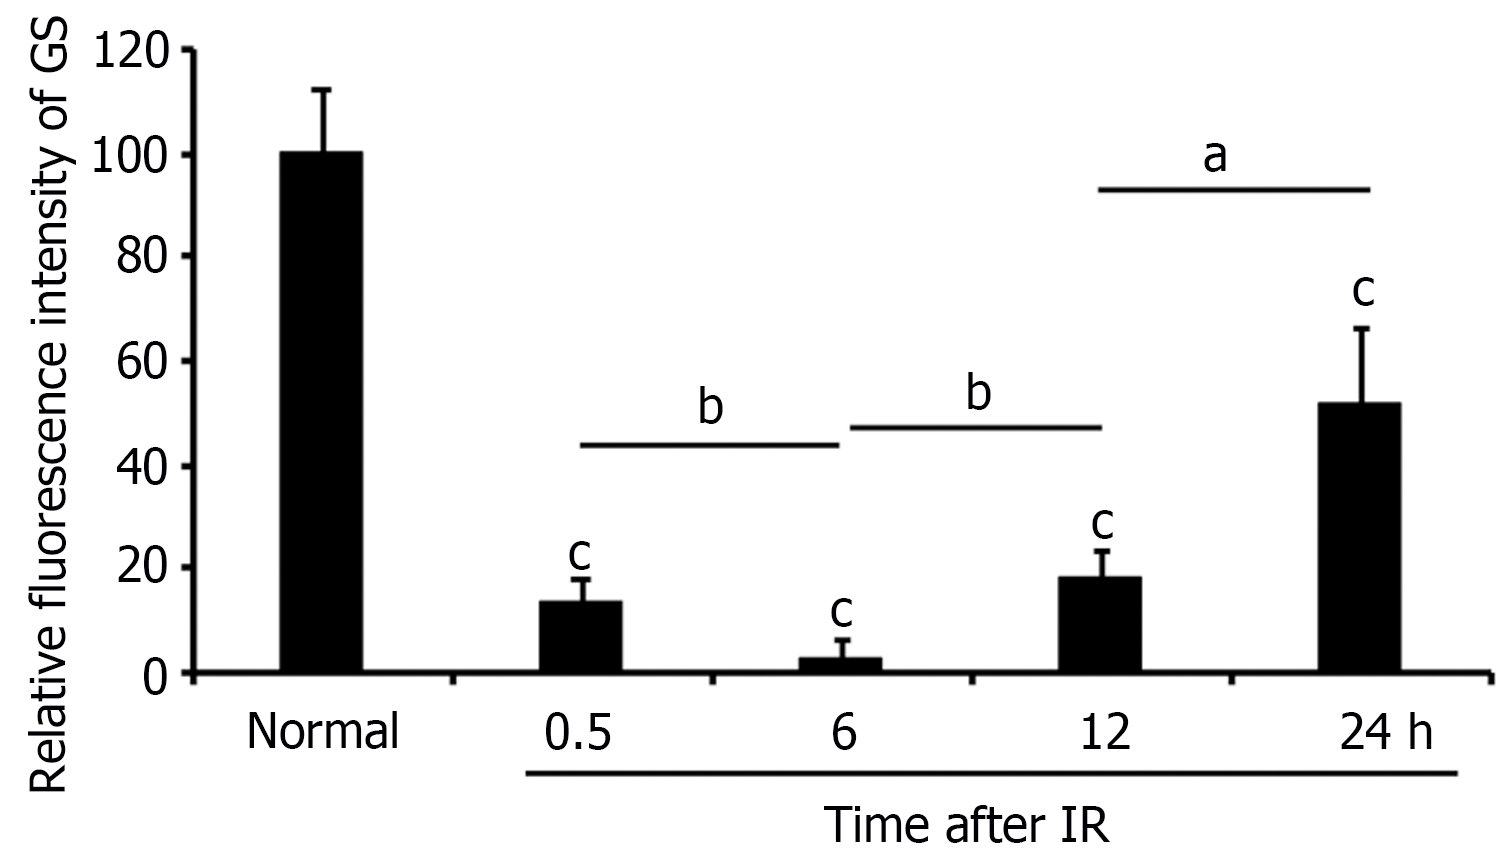
Figure 6 Changes in glutamine synthetase expression at different time points during liver ischemia-reperfusion.
The glutamine synthetase-positive area in the central vein region in the images of Figures 1-5 was analyzed using Image J. The values of the normal group were used as the baseline, and the values of the groups at different time points after ischemia-reperfusion were compared to those of the normal group. Mean ± SEM. IR: Ischemia-reperfusion; GS: Glutamine synthetase. aP < 0.05, bP < 0.01, cP < 0.001.
- Citation: Huang ZH, Dong MQ, Liu FY, Zhou WJ. Dynamics of glutamine synthetase expression in hepatic ischemia-reperfusion injury: Implications for therapeutic interventions. World J Hepatol 2024; 16(8): 1177-1184
- URL: https://www.wjgnet.com/1948-5182/full/v16/i8/1177.htm
- DOI: https://dx.doi.org/10.4254/wjh.v16.i8.1177


