Copyright
©The Author(s) 2021.
World J Hepatol. Jun 27, 2021; 13(6): 662-672
Published online Jun 27, 2021. doi: 10.4254/wjh.v13.i6.662
Published online Jun 27, 2021. doi: 10.4254/wjh.v13.i6.662
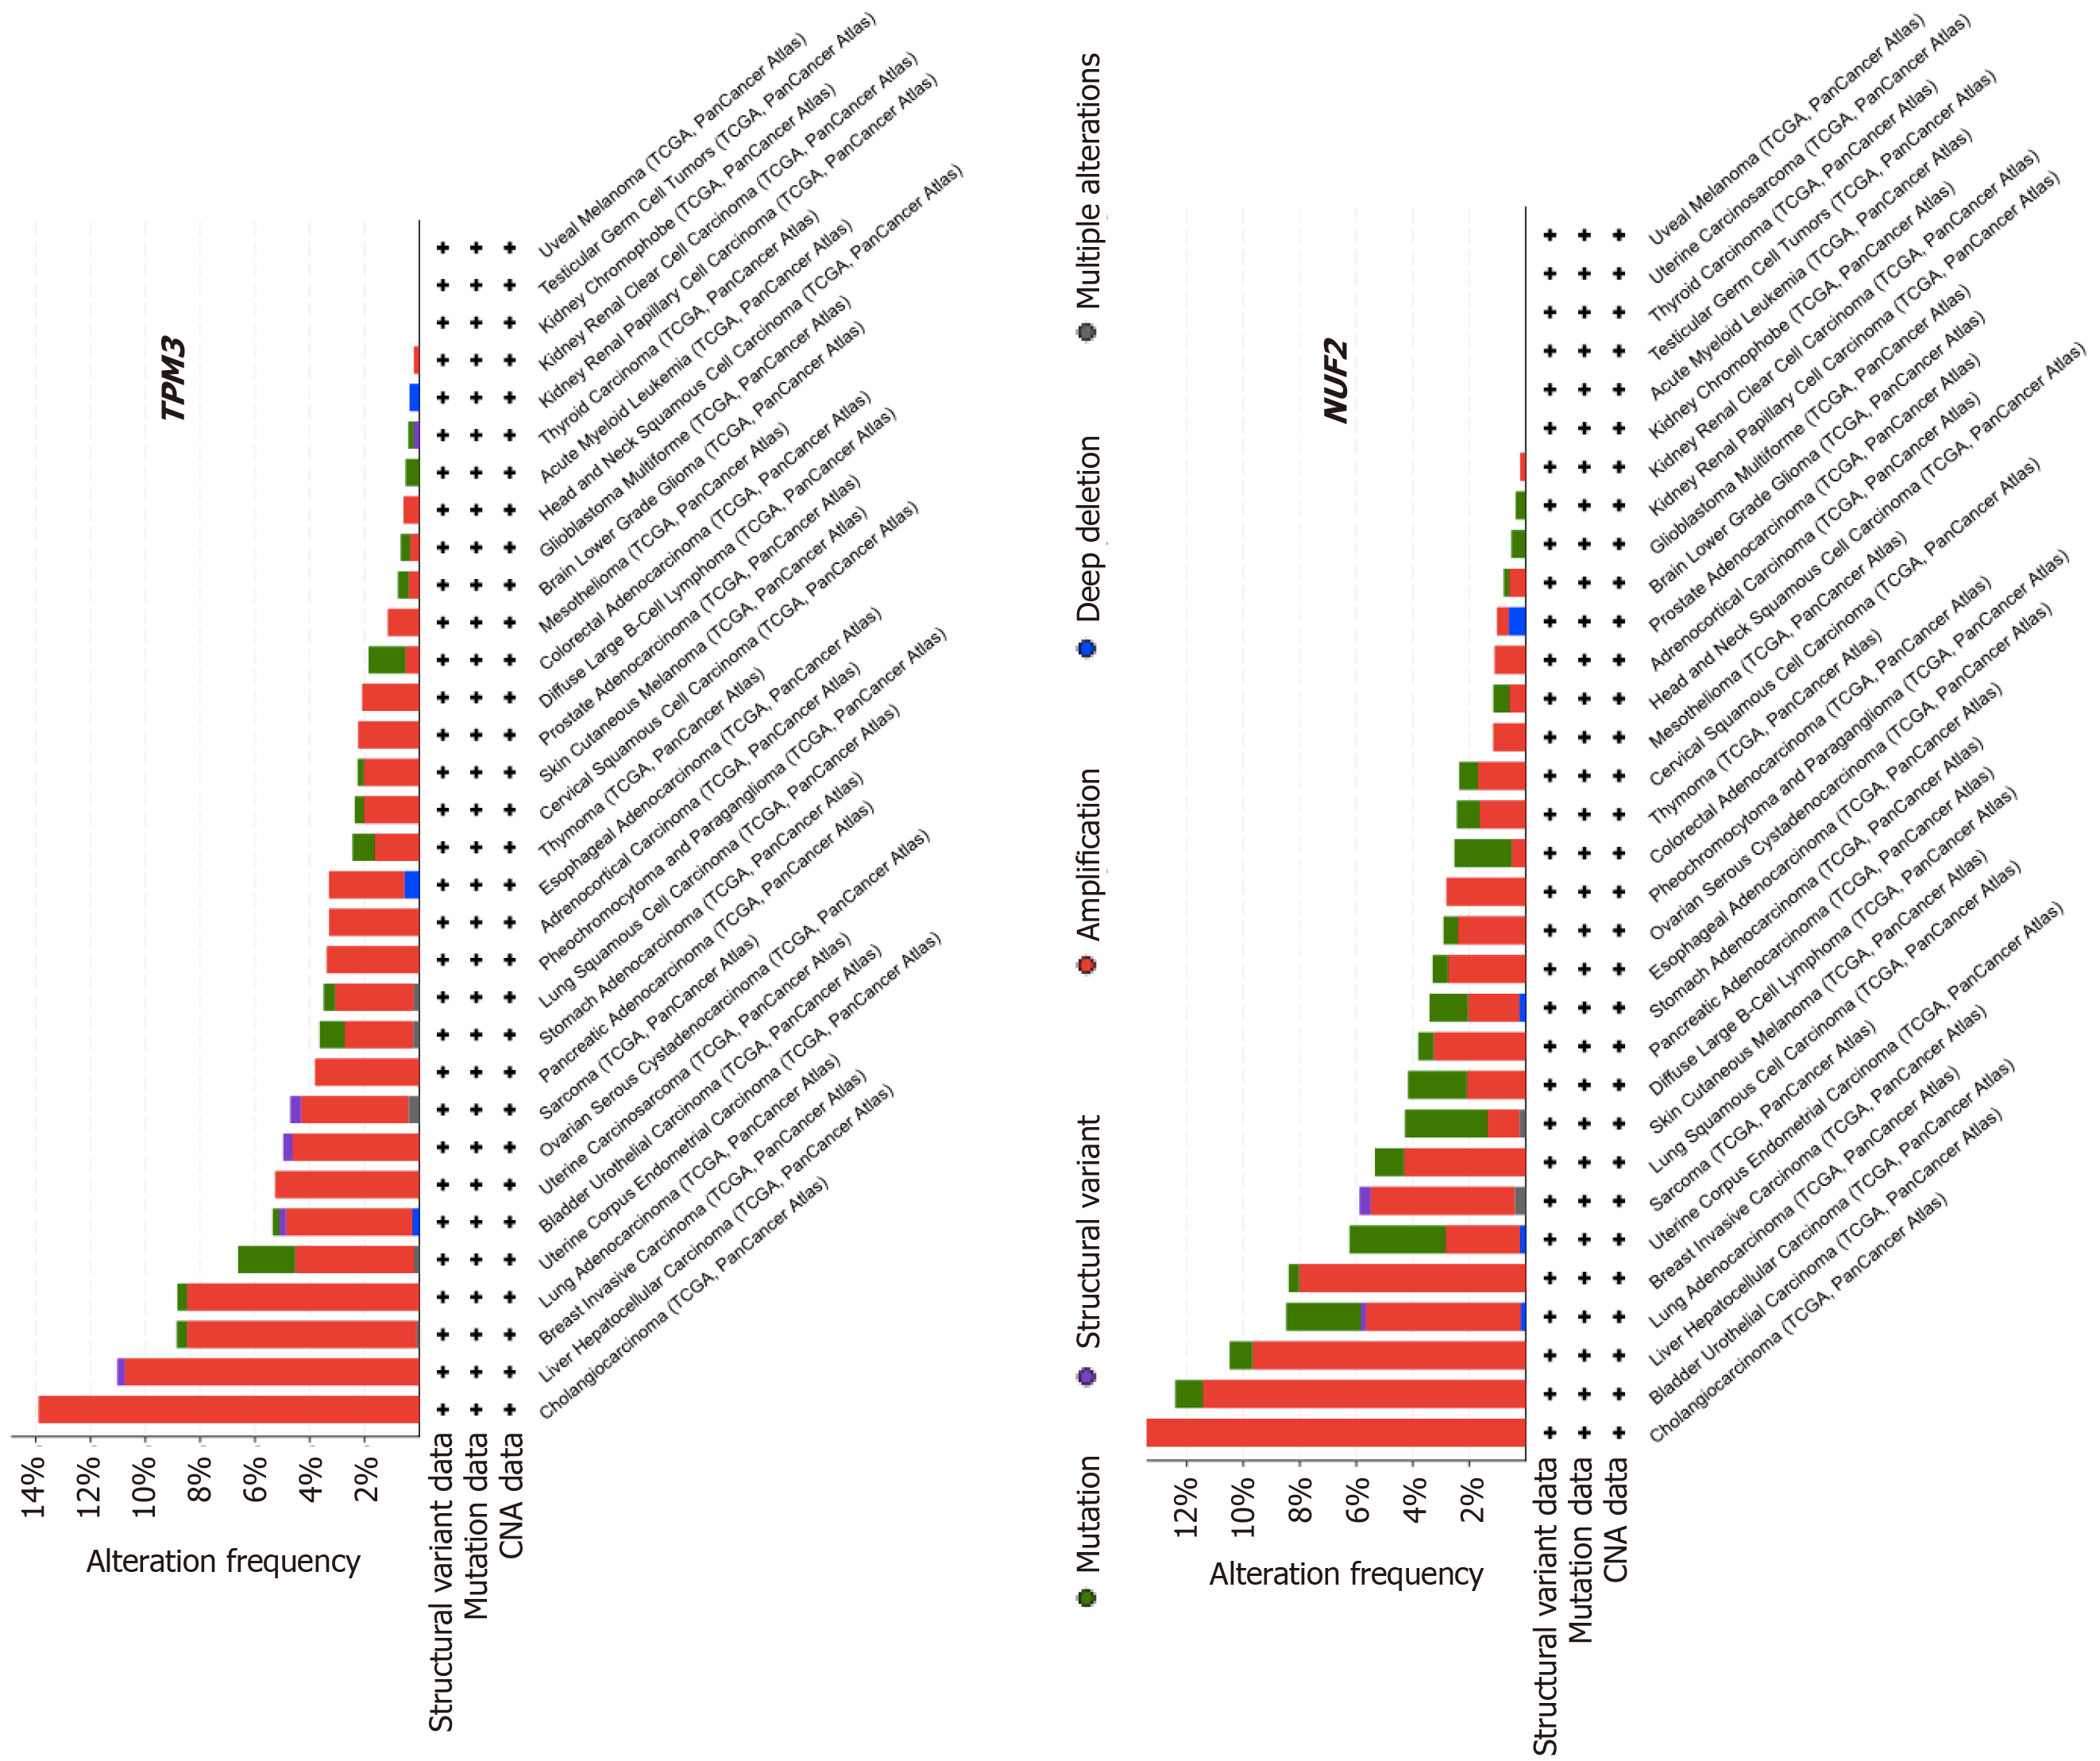
Figure 2 Frequency of TPM3 or NUF2 alterations in other cancers.
Analyses from cBioPortal show the percent of cancer cases that include a TPM3 gene alteration (upper plot) or a NUF2 gene alteration. The results were generated by first selecting all 32 of The Cancer Genome Atlas PanCancer Atlas studies[41] from the cBioPortal Query page, and then searching for DNA alterations in the TPM3 gene and NUF2 gene individually. Graphs shown in this figure were taken from the Cancer Types Summary results page that is produced by cBioPortal following this search. The colors above represent the following: green, mutation; purple, fusion; red, amplification; blue, deep deletion; grey, multiple alterations.
- Citation: Jacobs NR, Norton PA. Role of chromosome 1q copy number variation in hepatocellular carcinoma. World J Hepatol 2021; 13(6): 662-672
- URL: https://www.wjgnet.com/1948-5182/full/v13/i6/662.htm
- DOI: https://dx.doi.org/10.4254/wjh.v13.i6.662


