Copyright
©The Author(s) 2018.
World J Hepatol. Feb 27, 2018; 10(2): 277-286
Published online Feb 27, 2018. doi: 10.4254/wjh.v10.i2.277
Published online Feb 27, 2018. doi: 10.4254/wjh.v10.i2.277
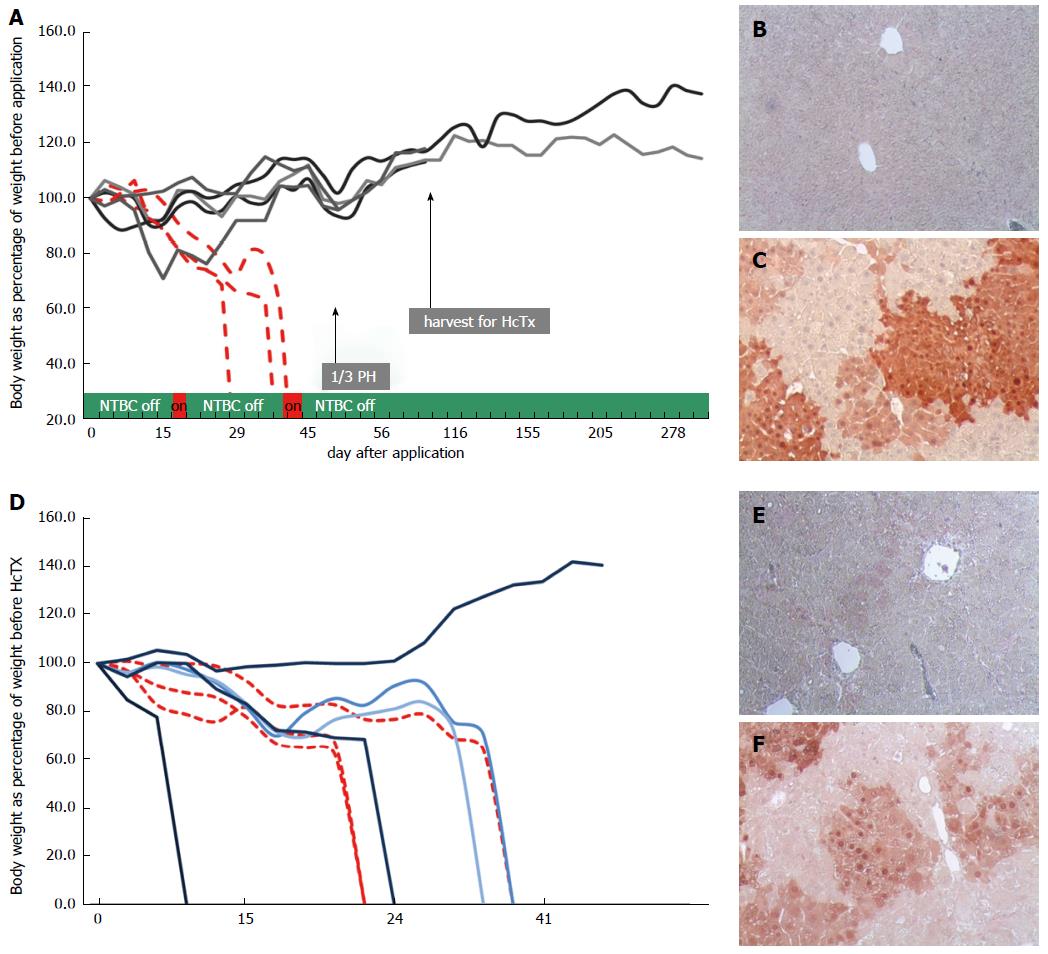
Figure 3 Mice treated with rAAV8-TTR.
Fah. A: Weight graph and survival for first-generation mice injected with rAAV8-TTR.Fah (n = 5) and 3 untreated controls (injected with sodium chloride). Continuous line = rAAV8-TTR.Fah mice, broken line = controls (same control mice as displayed at Figure 2A). Body weight is displayed as percentage of body weight at the time of virus injection or sodium chloride injection (controls). The timeline (x-axis) is displayed in days beginning with the day of virus/sodium chloride injection as day zero; B: FAH staining of liver tissue from controls (mouse with sodium chloride injection) after death (100 × magnification); C: FAH staining of liver tissue from a partial hepatectomy from a mouse injected with rAAV8-TTR.Fah (100 × magnification); D: Weight graph and survival for second-generation mice (continuous line), which were transplanted with one million hepatocytes from mice primarily injected with rAAV8-TTR.Fah and controls (same control mice as displayed at Figure 2D) without hepatocyte transplantation (broken line). Body weight is displayed as percentage of body weight at time of hepatocyte transplantation. The timeline (x-axis) is displayed in days, beginning with the day of hepatocyte transplantation as day zero; E: FAH staining of liver tissue from a partial hepatectomy in a second-generation mouse, which received one million hepatocytes from mice primarily injected with rAAV8-TTR.Fah (100 × magnification); F: FAH staining of liver tissue from a partial hepatectomy from the single second-generation mouse that showed cluster and weight gain.
- Citation: Junge N, Yuan Q, Vu TH, Krooss S, Bednarski C, Balakrishnan A, Cathomen T, Manns MP, Baumann U, Sharma AD, Ott M. Homologous recombination mediates stable Fah gene integration and phenotypic correction in tyrosinaemia mouse-model. World J Hepatol 2018; 10(2): 277-286
- URL: https://www.wjgnet.com/1948-5182/full/v10/i2/277.htm
- DOI: https://dx.doi.org/10.4254/wjh.v10.i2.277


