Copyright
©2009 Baishideng.
World J Hepatol. Oct 31, 2009; 1(1): 98-102
Published online Oct 31, 2009. doi: 10.4254/wjh.v1.i1.98
Published online Oct 31, 2009. doi: 10.4254/wjh.v1.i1.98
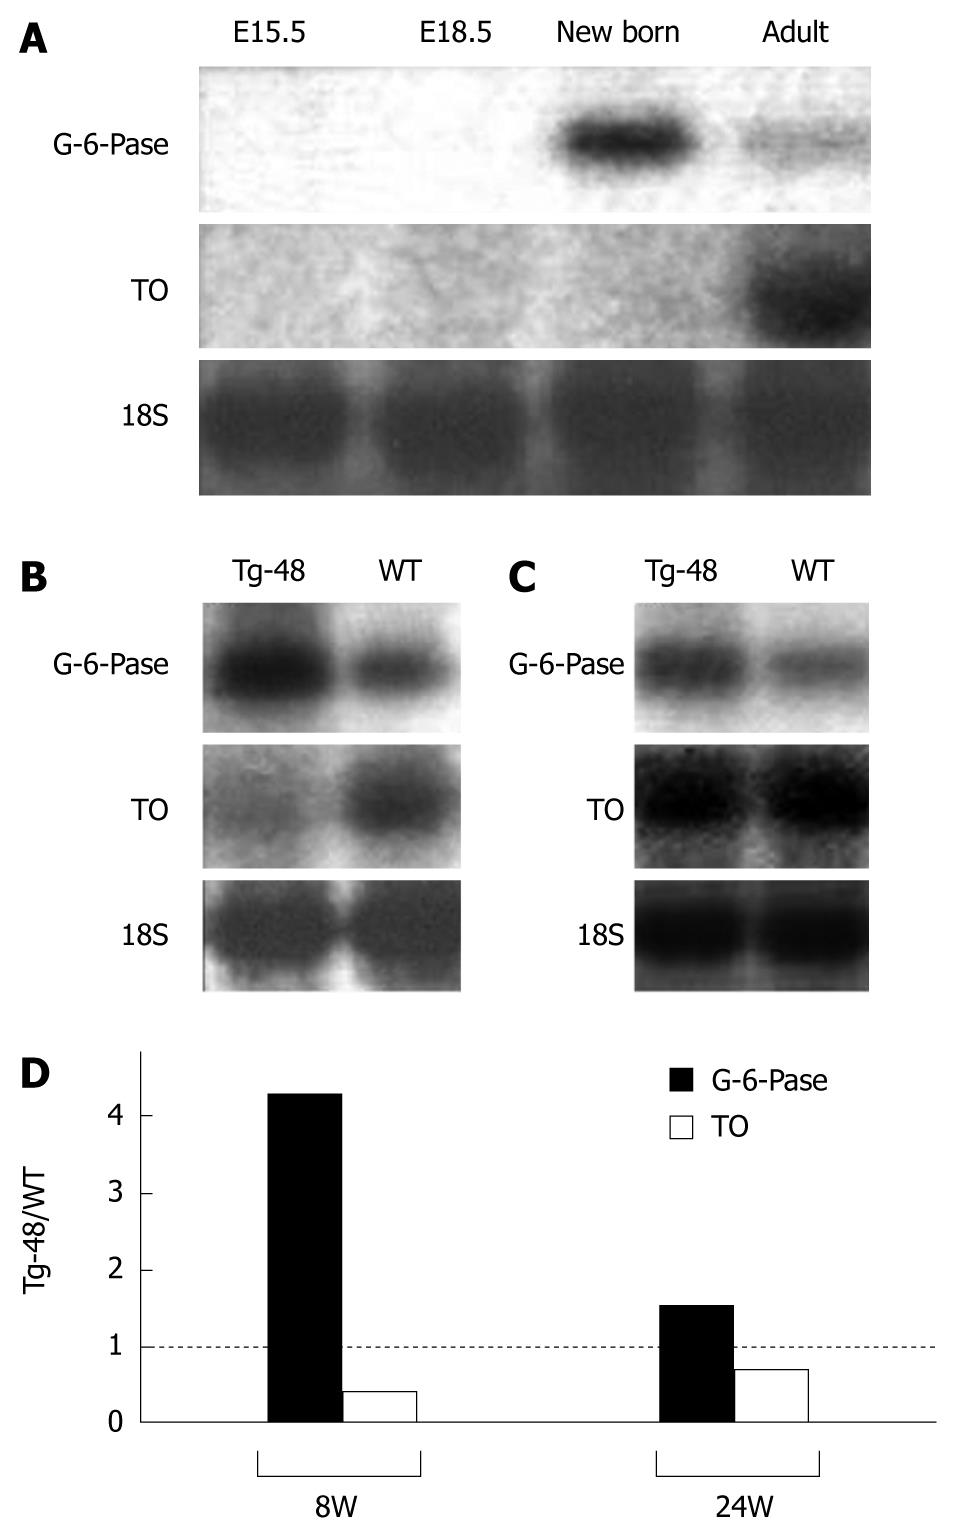
Figure 3 The expression of differentiation marker genes of hepatocytes.
A: The expression of differentiation marker genes of hepatocytes in normal mice. RNA was extracted from fetal mice of E (embryonic day) 13.5 and 15.5, and postnatal mice of zero weeks (new born) and 8 wk after birth. Twenty micrograms of total RNA was loaded and hybridized with mouse cDNA probes. Ribosomal RNA of 18S is shown in the lowest panel; B: The expression of differentiation marker genes of hepatocytes in adult (8 wk) transgenic mice. In the control liver of 8-wk-old mouse, G-6-Pase expression is low and TO expression is high. In contrast, G-6-Pase expression is high and TO expression is low in the transgenic liver. Ribosomal RNA of 18S is shown in the lowest panel; C: The expression of differentiation marker genes of hepatocytes in adult (24w) transgenic mice. Unlike the 8-wk-old mouse, expression levels of G-6-Pase and TO show small differences between the transgenic liver and the normal liver. Ribosomal RNA of 18S is shown in the lowest panel. D: Densitometry measurements of Northern blot analysis. Northern blot signals in Figure 3B and C were measured and normalized by the internal control bands (18S). The expression levels of G-6-Pase and TO in the liver of Tg-48 mouse were compared with the levels in the control liver. The ratios of band intensities (Tg-48/WT) were graphically shown. Two independent experiments were conducted in duplicate, and similar results were obtained.
- Citation: Enomoto H, Nakamura H, Komatsu-Kanatani N, Liu Y, Yoshida K, Okuda Y, Yamamoto T, Liu W, Nishiguchi S. Partial blockage of hepatocyte maturation in hepatoma-derived growth factor transgenic mice. World J Hepatol 2009; 1(1): 98-102
- URL: https://www.wjgnet.com/1948-5182/full/v1/i1/98.htm
- DOI: https://dx.doi.org/10.4254/wjh.v1.i1.98


