Copyright
©2011 Baishideng Publishing Group Co.
World J Stem Cells. Feb 26, 2011; 3(2): 9-18
Published online Feb 26, 2011. doi: 10.4252/wjsc.v3.i2.9
Published online Feb 26, 2011. doi: 10.4252/wjsc.v3.i2.9
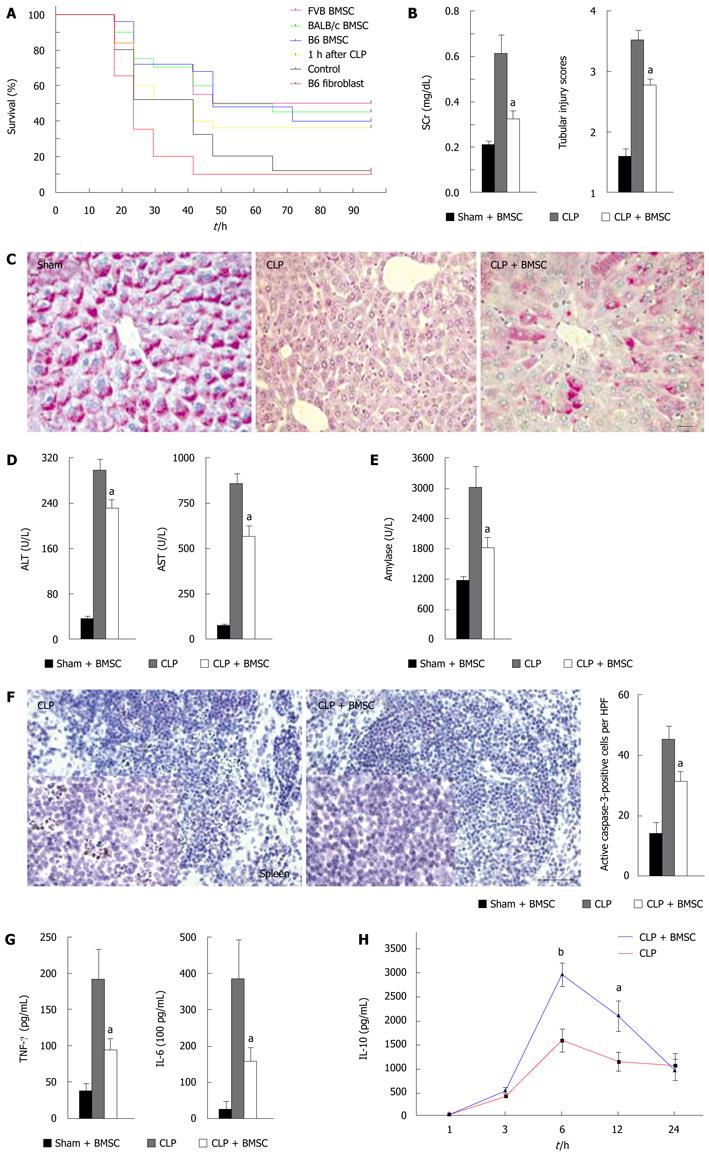
Figure 3 Effect of intravenous injection of BMSCs on the course of sepsis after cecal ligation and puncture.
A: Survival curves of mice after cecal ligation and puncture (CLP) and a variety of treatments using BMSCs from C57/BL6, FVB/NJ and BALB/c mice, as well as C57/BL6-derived fibroblasts; B: BMSC treatment effects on kidney function, as reflected by serum concentration of creatinine (SCr). The number of mice in all measurements is as follows: sham, n = 5; CLP, n = 13; CLP + BMSC, n = 14. Tubular injury scores are shown at right; C: Intense PAS staining of hepatocytes is shown after sham operation and BMSC treatment. No staining can be seen in CLP. After treatment (CLP + BMSC), the red staining by PAS in hepatocytes indicates partial glycogen storage capacity. Scale bar, 20 μm; D: Alanine aminotransferase (ALT) and aspartate aminotransferase (AST) concentrations in the liver after sham and BMSC, CLP or CLP and BMSC treatment; E: Serum amylase concentrations after sham and BMSC, CLP or CLP and BMSC treatment; F: DAB staining of caspase-3 cells in untreated spleen sections and BMSC-treated spleen sections. A quantitative comparison between the numbers of apoptotic splenic cells in treated versus untreated mice (right) shows a significant decrease with BMSC treatment. Scale bar, 100 μm; G: Serum tumor necrosis factor (TNF)-α and interleukin (IL)-6 concentrations after sham and BMSC, CLP or CLP and BMSC treatment; H: Serum IL-10 concentrations at 3, 6 and 12 h after CLP. n = 8-11 at each time point. Error bars represent means ± SE; aP < 0.05; bP < 0.01. Reproduced with permission[36].
-
Citation: Walker PA, Letourneau PA, Bedi S, Shah SK, Jimenez F, Jr CSC. Progenitor cells as remote "bioreactors": Neuroprotection
via modulation of the systemic inflammatory response. World J Stem Cells 2011; 3(2): 9-18 - URL: https://www.wjgnet.com/1948-0210/full/v3/i2/9.htm
- DOI: https://dx.doi.org/10.4252/wjsc.v3.i2.9


