Copyright
©The Author(s) 2019.
World J Stem Cells. Jan 26, 2019; 11(1): 1-12
Published online Jan 26, 2019. doi: 10.4252/wjsc.v11.i1.1
Published online Jan 26, 2019. doi: 10.4252/wjsc.v11.i1.1
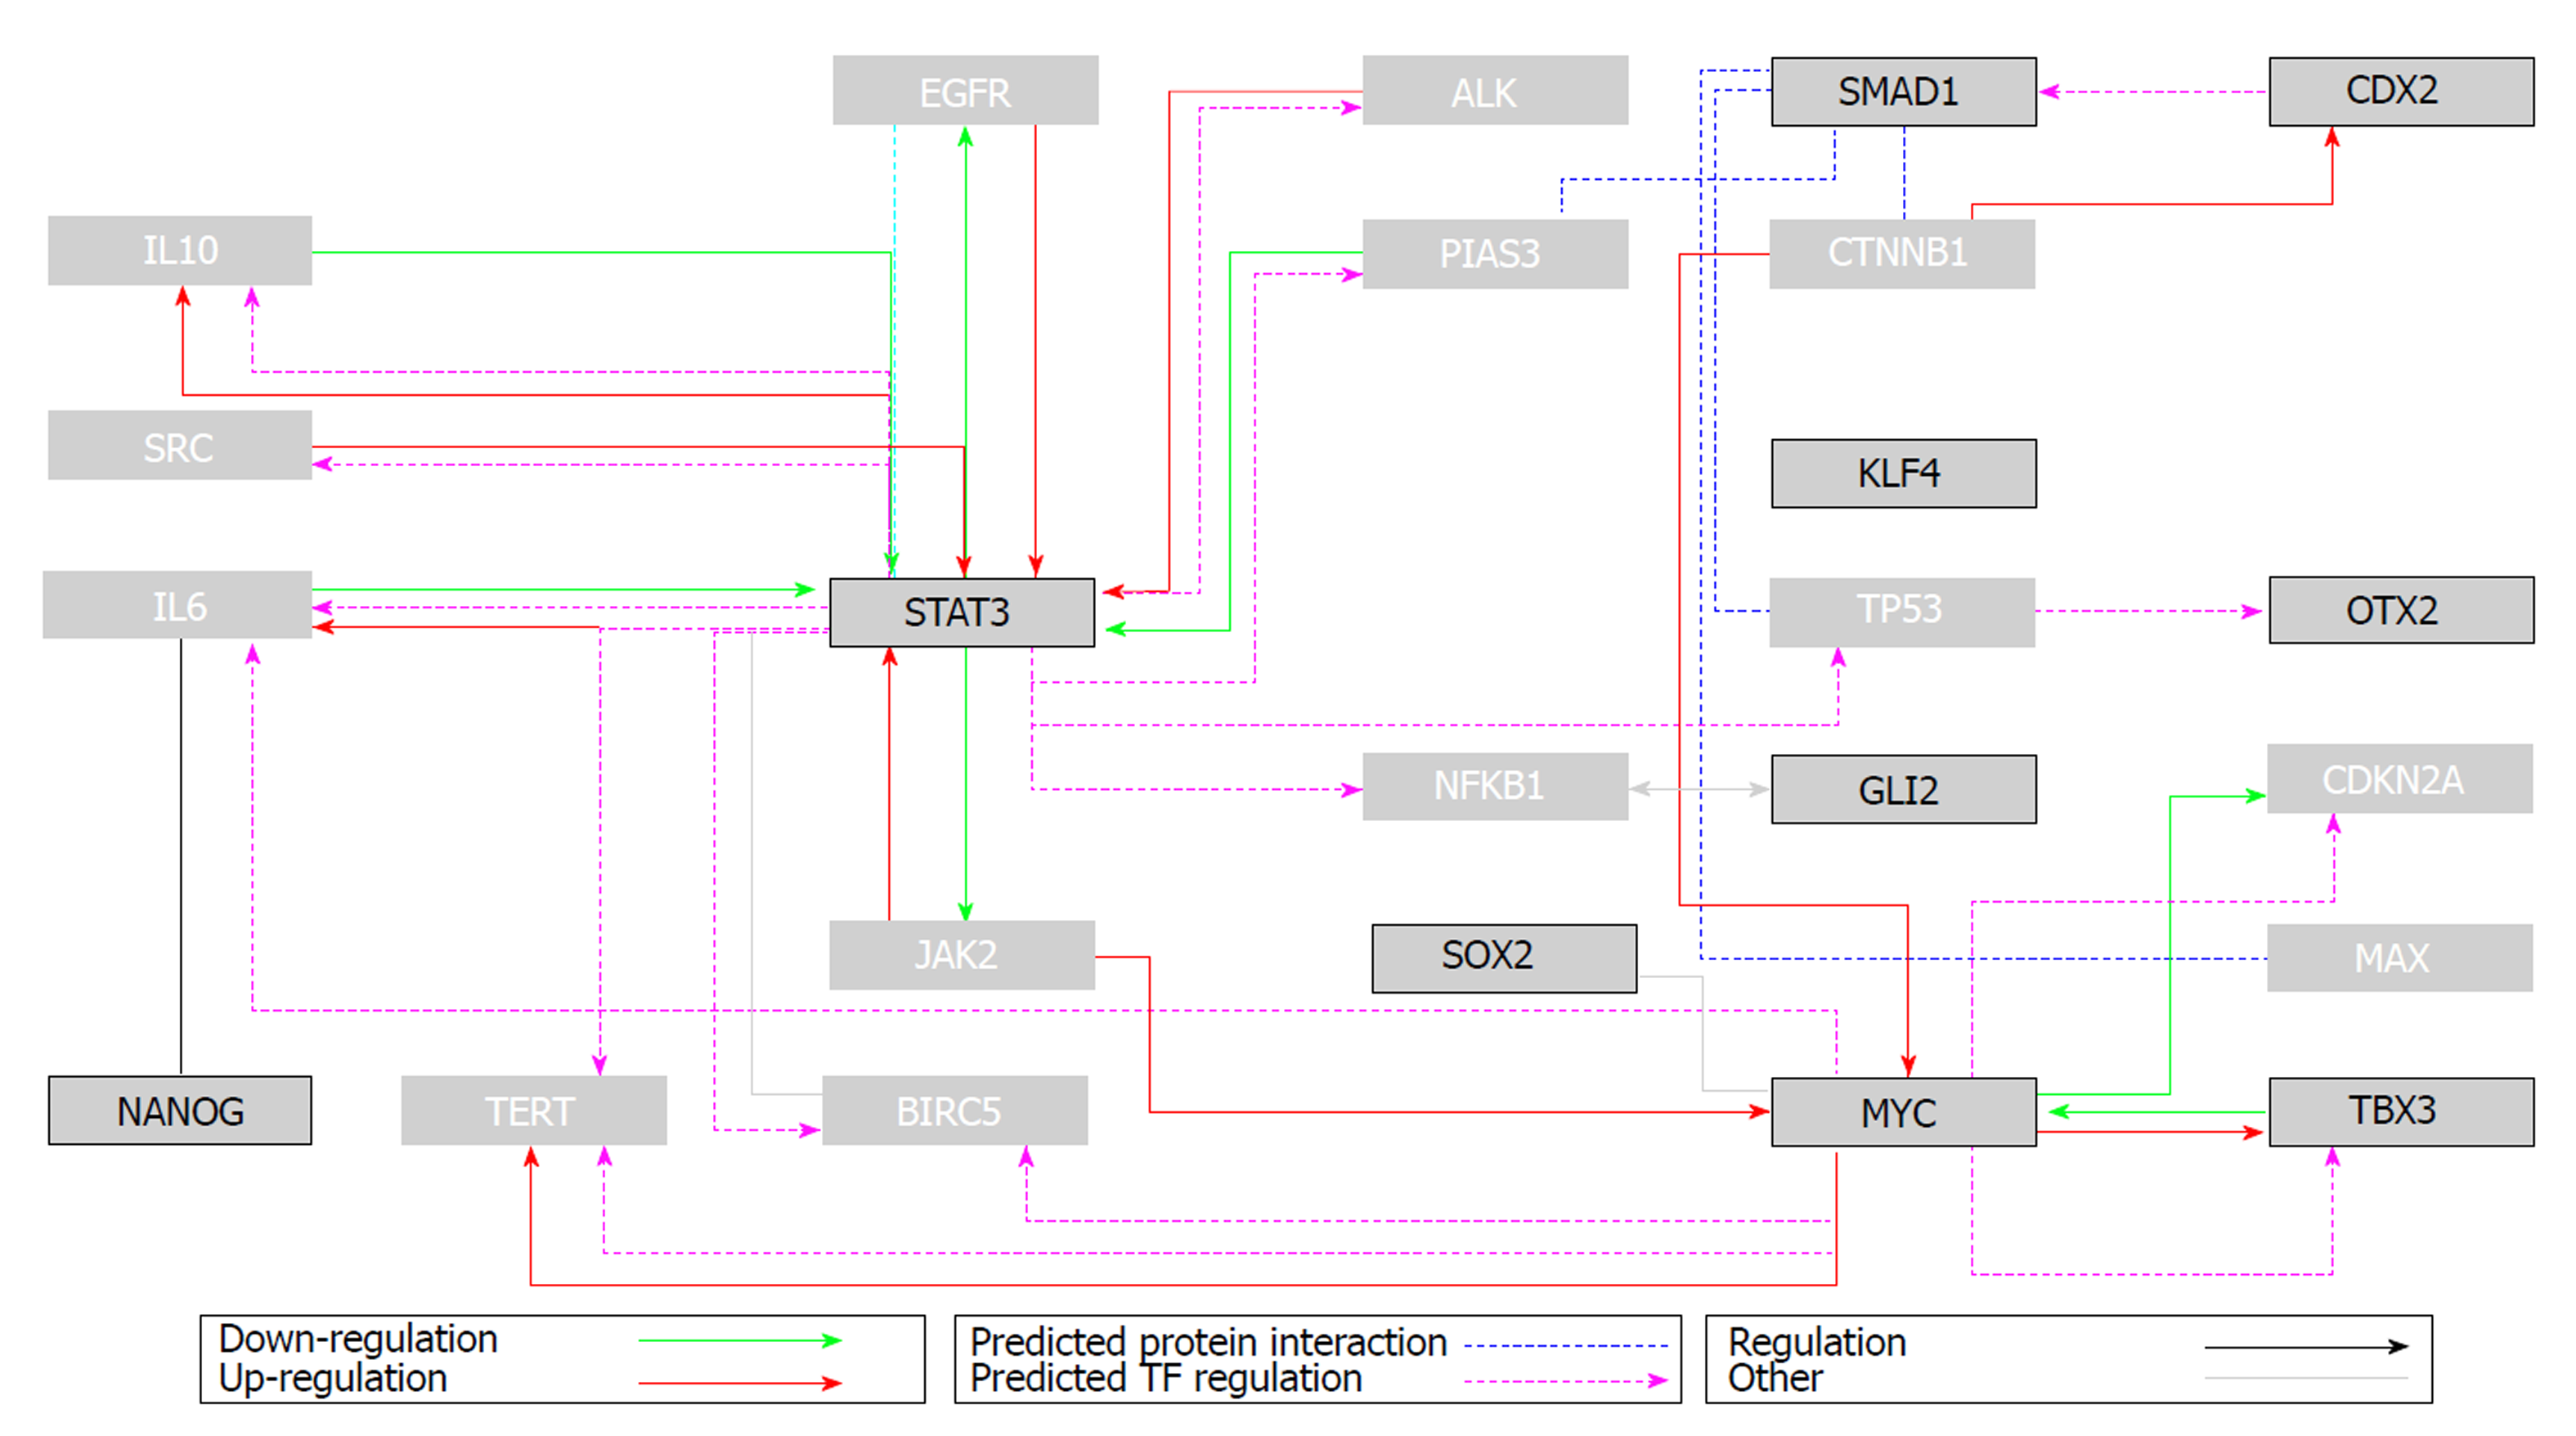
Figure 1 Flux diagram of the top 10 ranked genes related to pluripotency (interaction data obtained from GNCPro, SABiosciences).
Interactions: downregulation (green arrow), upregulation (red arrow), predicted transcription factor regulation (magenta arrow), predicted protein interaction (blue line), regulation (black arrow), other types of regulation (grey line). See the electronic version for colour figures. Boxes outlined in black represent the target genes, and light grey boxes their immediate neighbours. Adapted from Mashayekhi et al[11].
- Citation: Labusca L, Mashayekhi K. Human adult pluripotency: Facts and questions. World J Stem Cells 2019; 11(1): 1-12
- URL: https://www.wjgnet.com/1948-0210/full/v11/i1/1.htm
- DOI: https://dx.doi.org/10.4252/wjsc.v11.i1.1


