Copyright
©The Author(s) 2024.
World J Gastroenterol. Mar 21, 2024; 30(11): 1609-1620
Published online Mar 21, 2024. doi: 10.3748/wjg.v30.i11.1609
Published online Mar 21, 2024. doi: 10.3748/wjg.v30.i11.1609
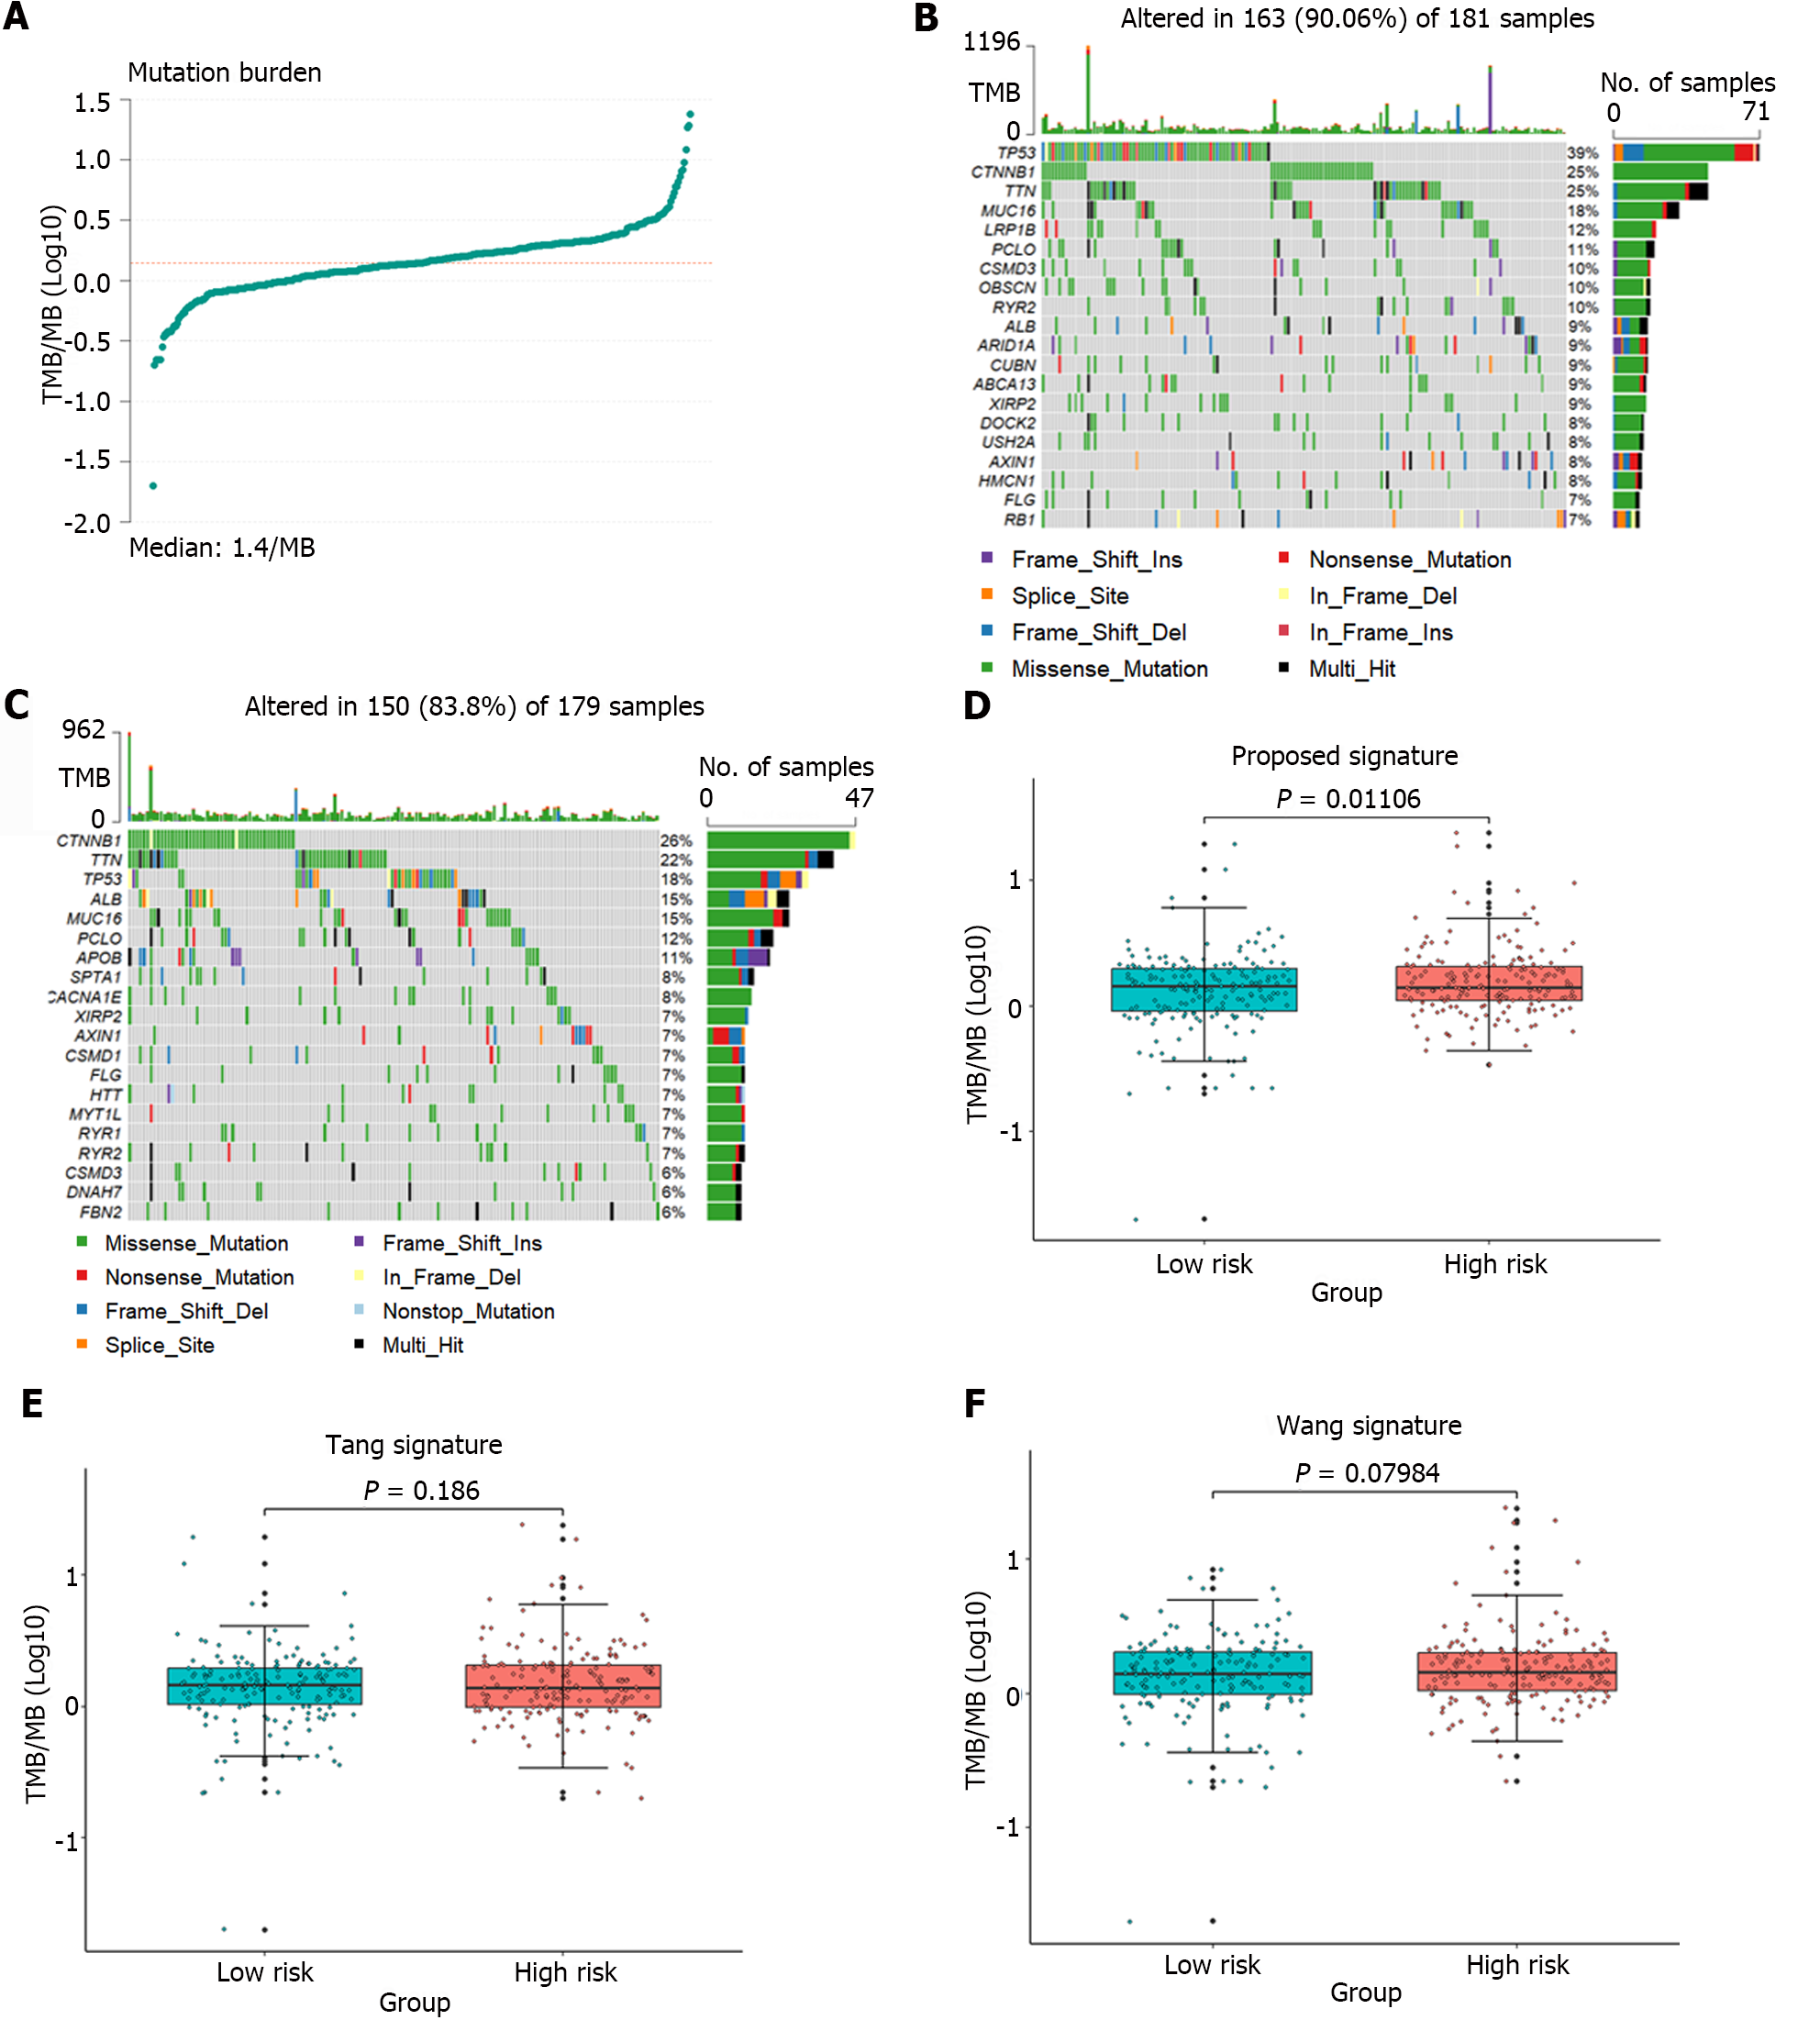
Figure 7 Analysis of the tumor mutation burden in the samples.
A: The distribution of tumor mutation burden (TMB) for all samples; B and C: Waterfall plots depicting mutation landscapes in the high-risk and low-risk groups, respectively; D-F: A comparative analysis of TMB was conducted in the high-risk and low-risk groups identified by the gene signature identified in this article and the groups identified by the gene signature proposed by Tang et al[11] and Wang et al[12].
- Citation: Li JT, Zhang HM, Wang W, Wei DQ. Identification of an immune-related gene signature for predicting prognosis and immunotherapy efficacy in liver cancer via cell-cell communication. World J Gastroenterol 2024; 30(11): 1609-1620
- URL: https://www.wjgnet.com/1007-9327/full/v30/i11/1609.htm
- DOI: https://dx.doi.org/10.3748/wjg.v30.i11.1609


