Copyright
©The Author(s) 2023.
World J Gastroenterol. Feb 14, 2023; 29(6): 1076-1089
Published online Feb 14, 2023. doi: 10.3748/wjg.v29.i6.1076
Published online Feb 14, 2023. doi: 10.3748/wjg.v29.i6.1076
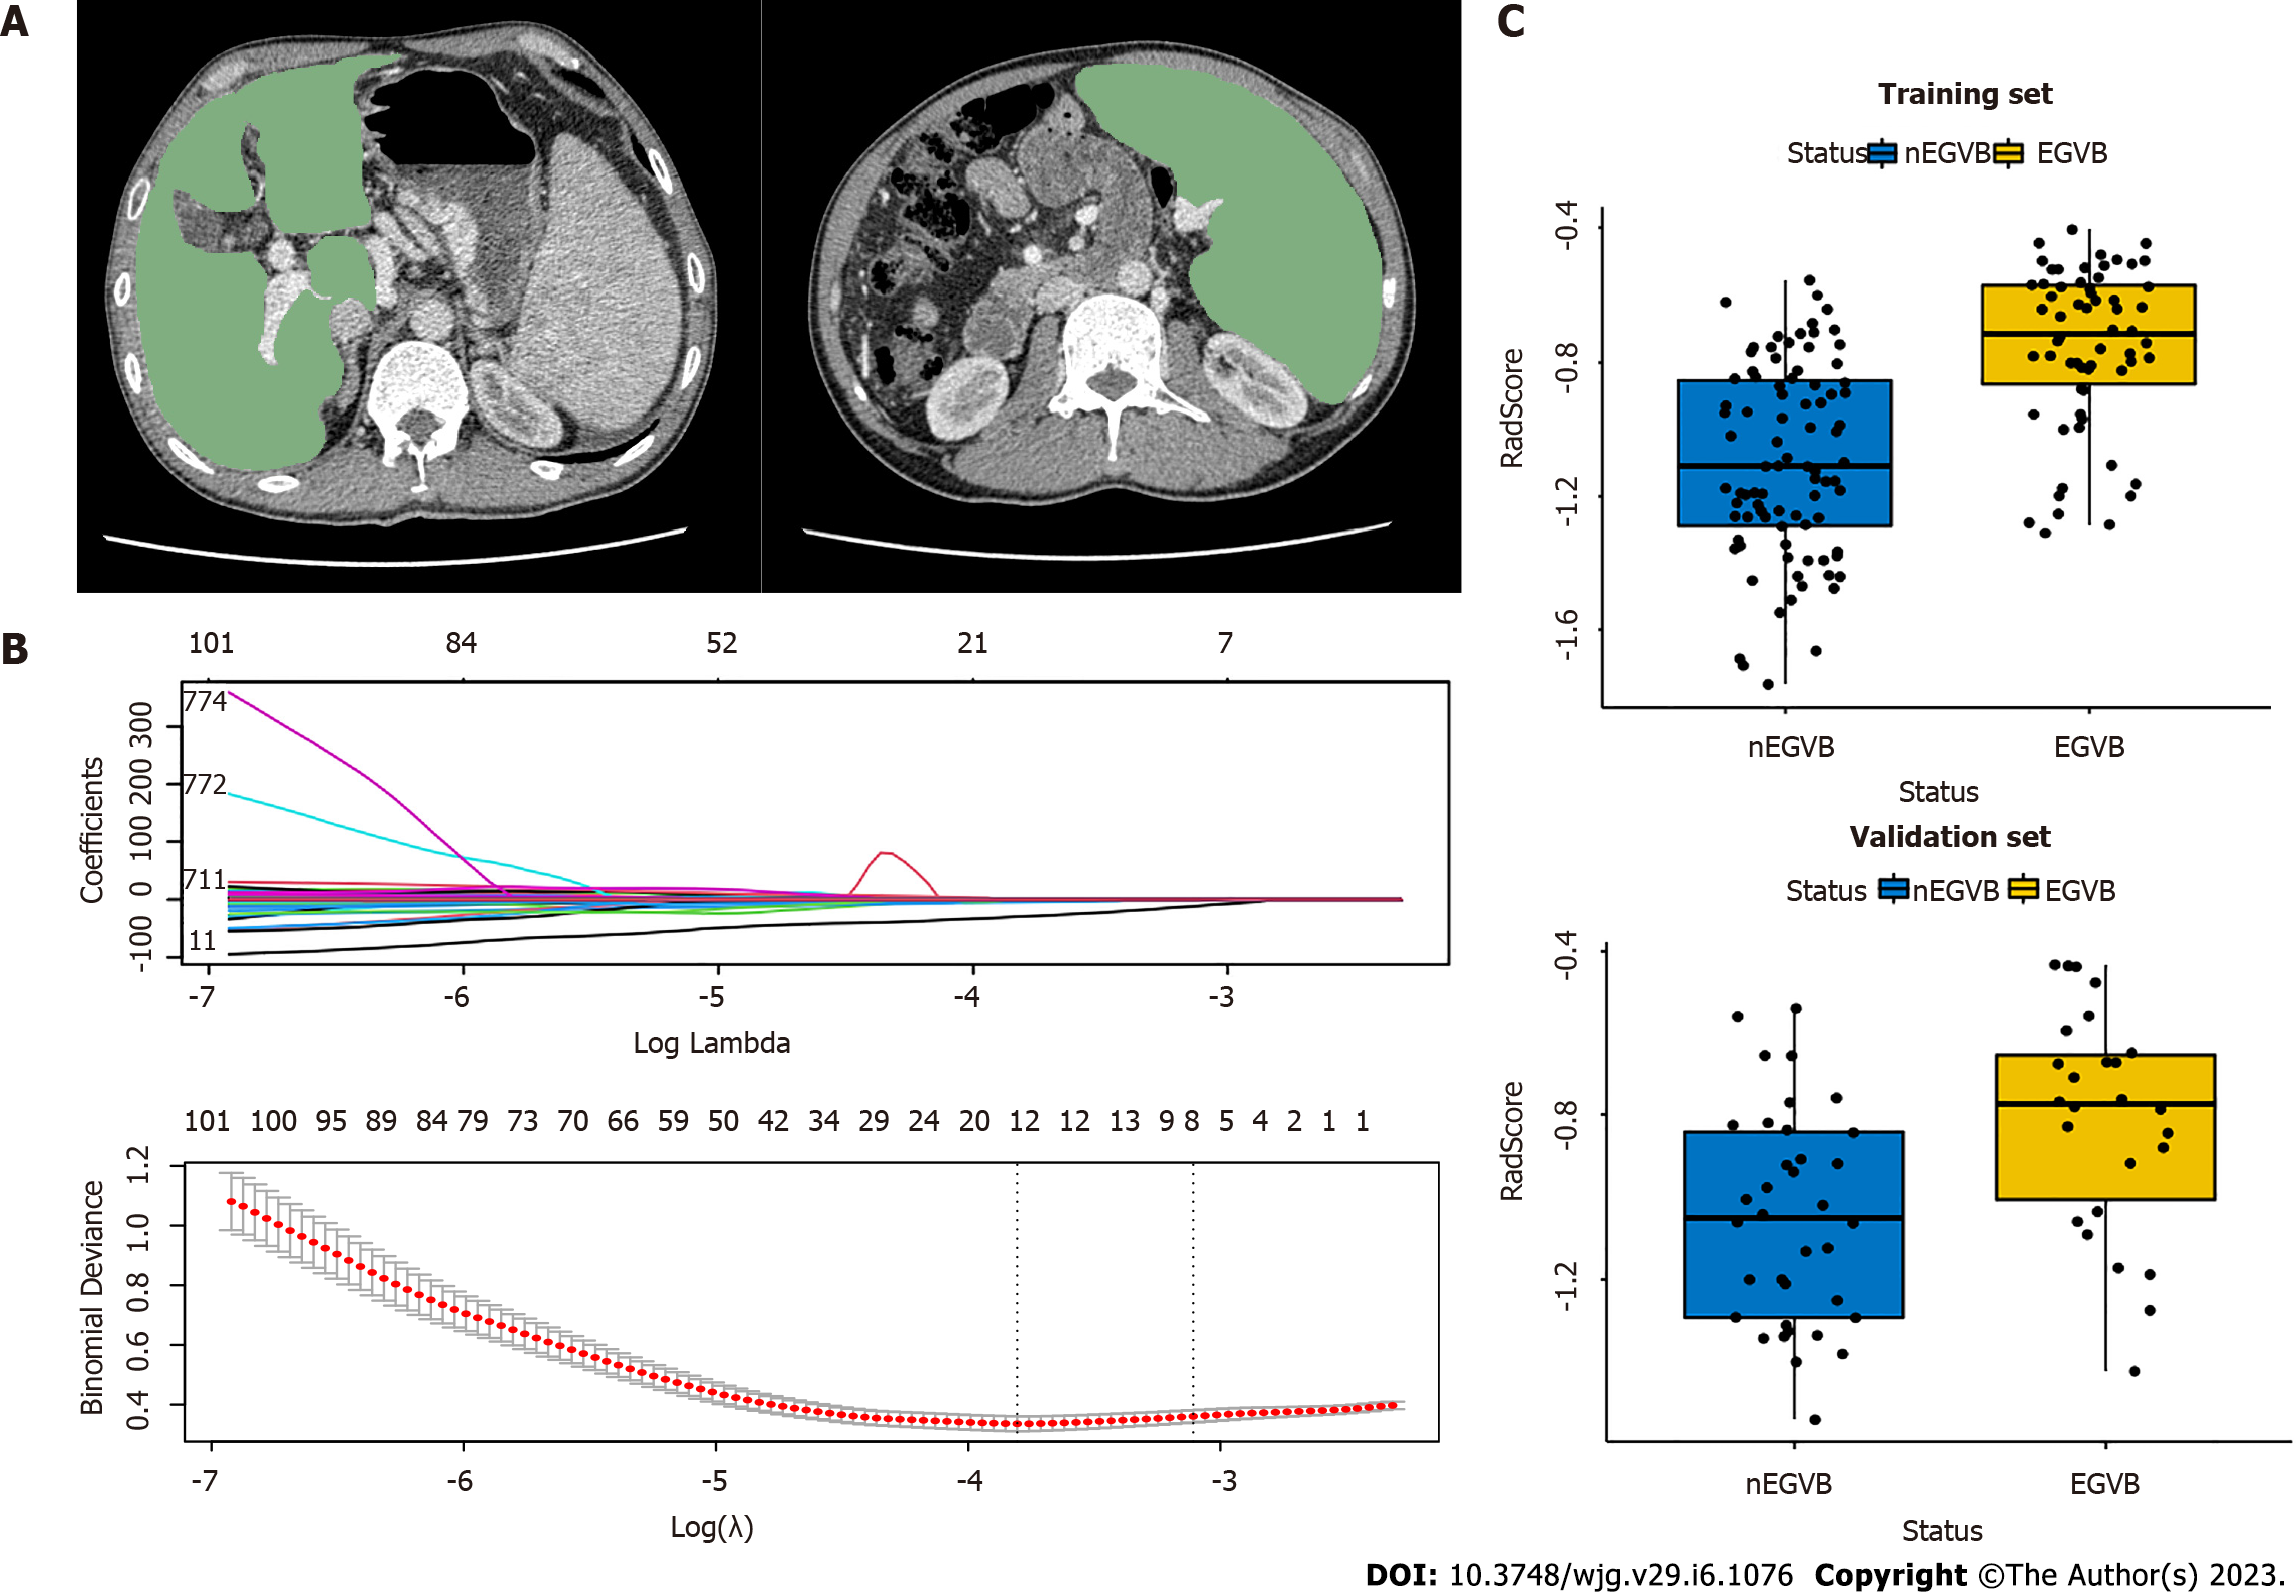
Figure 2 Workflow of the radiomics analysis.
A: The liver and spleen regions of interest were defined at the level of the hepatic hilum and the splenic hilum, respectively; B: The least absolute shrinkage and selection operator regression analysis for dimension reduction of radiomics features, and the optimal model parameter λ was selected by 10-fold cross-validation; C: The boxplots of radiomics signatures (RadScore) in the training and validation groups display notable differences respectively. EGVB: Esophagogastric variceal bleeding; nEGVB: Without the occurrence of esophagogastric variceal bleeding.
- Citation: Luo R, Gao J, Gan W, Xie WB. Clinical-radiomics nomogram for predicting esophagogastric variceal bleeding risk noninvasively in patients with cirrhosis. World J Gastroenterol 2023; 29(6): 1076-1089
- URL: https://www.wjgnet.com/1007-9327/full/v29/i6/1076.htm
- DOI: https://dx.doi.org/10.3748/wjg.v29.i6.1076


