Copyright
©The Author(s) 2023.
World J Gastroenterol. Dec 28, 2023; 29(48): 6222-6234
Published online Dec 28, 2023. doi: 10.3748/wjg.v29.i48.6222
Published online Dec 28, 2023. doi: 10.3748/wjg.v29.i48.6222
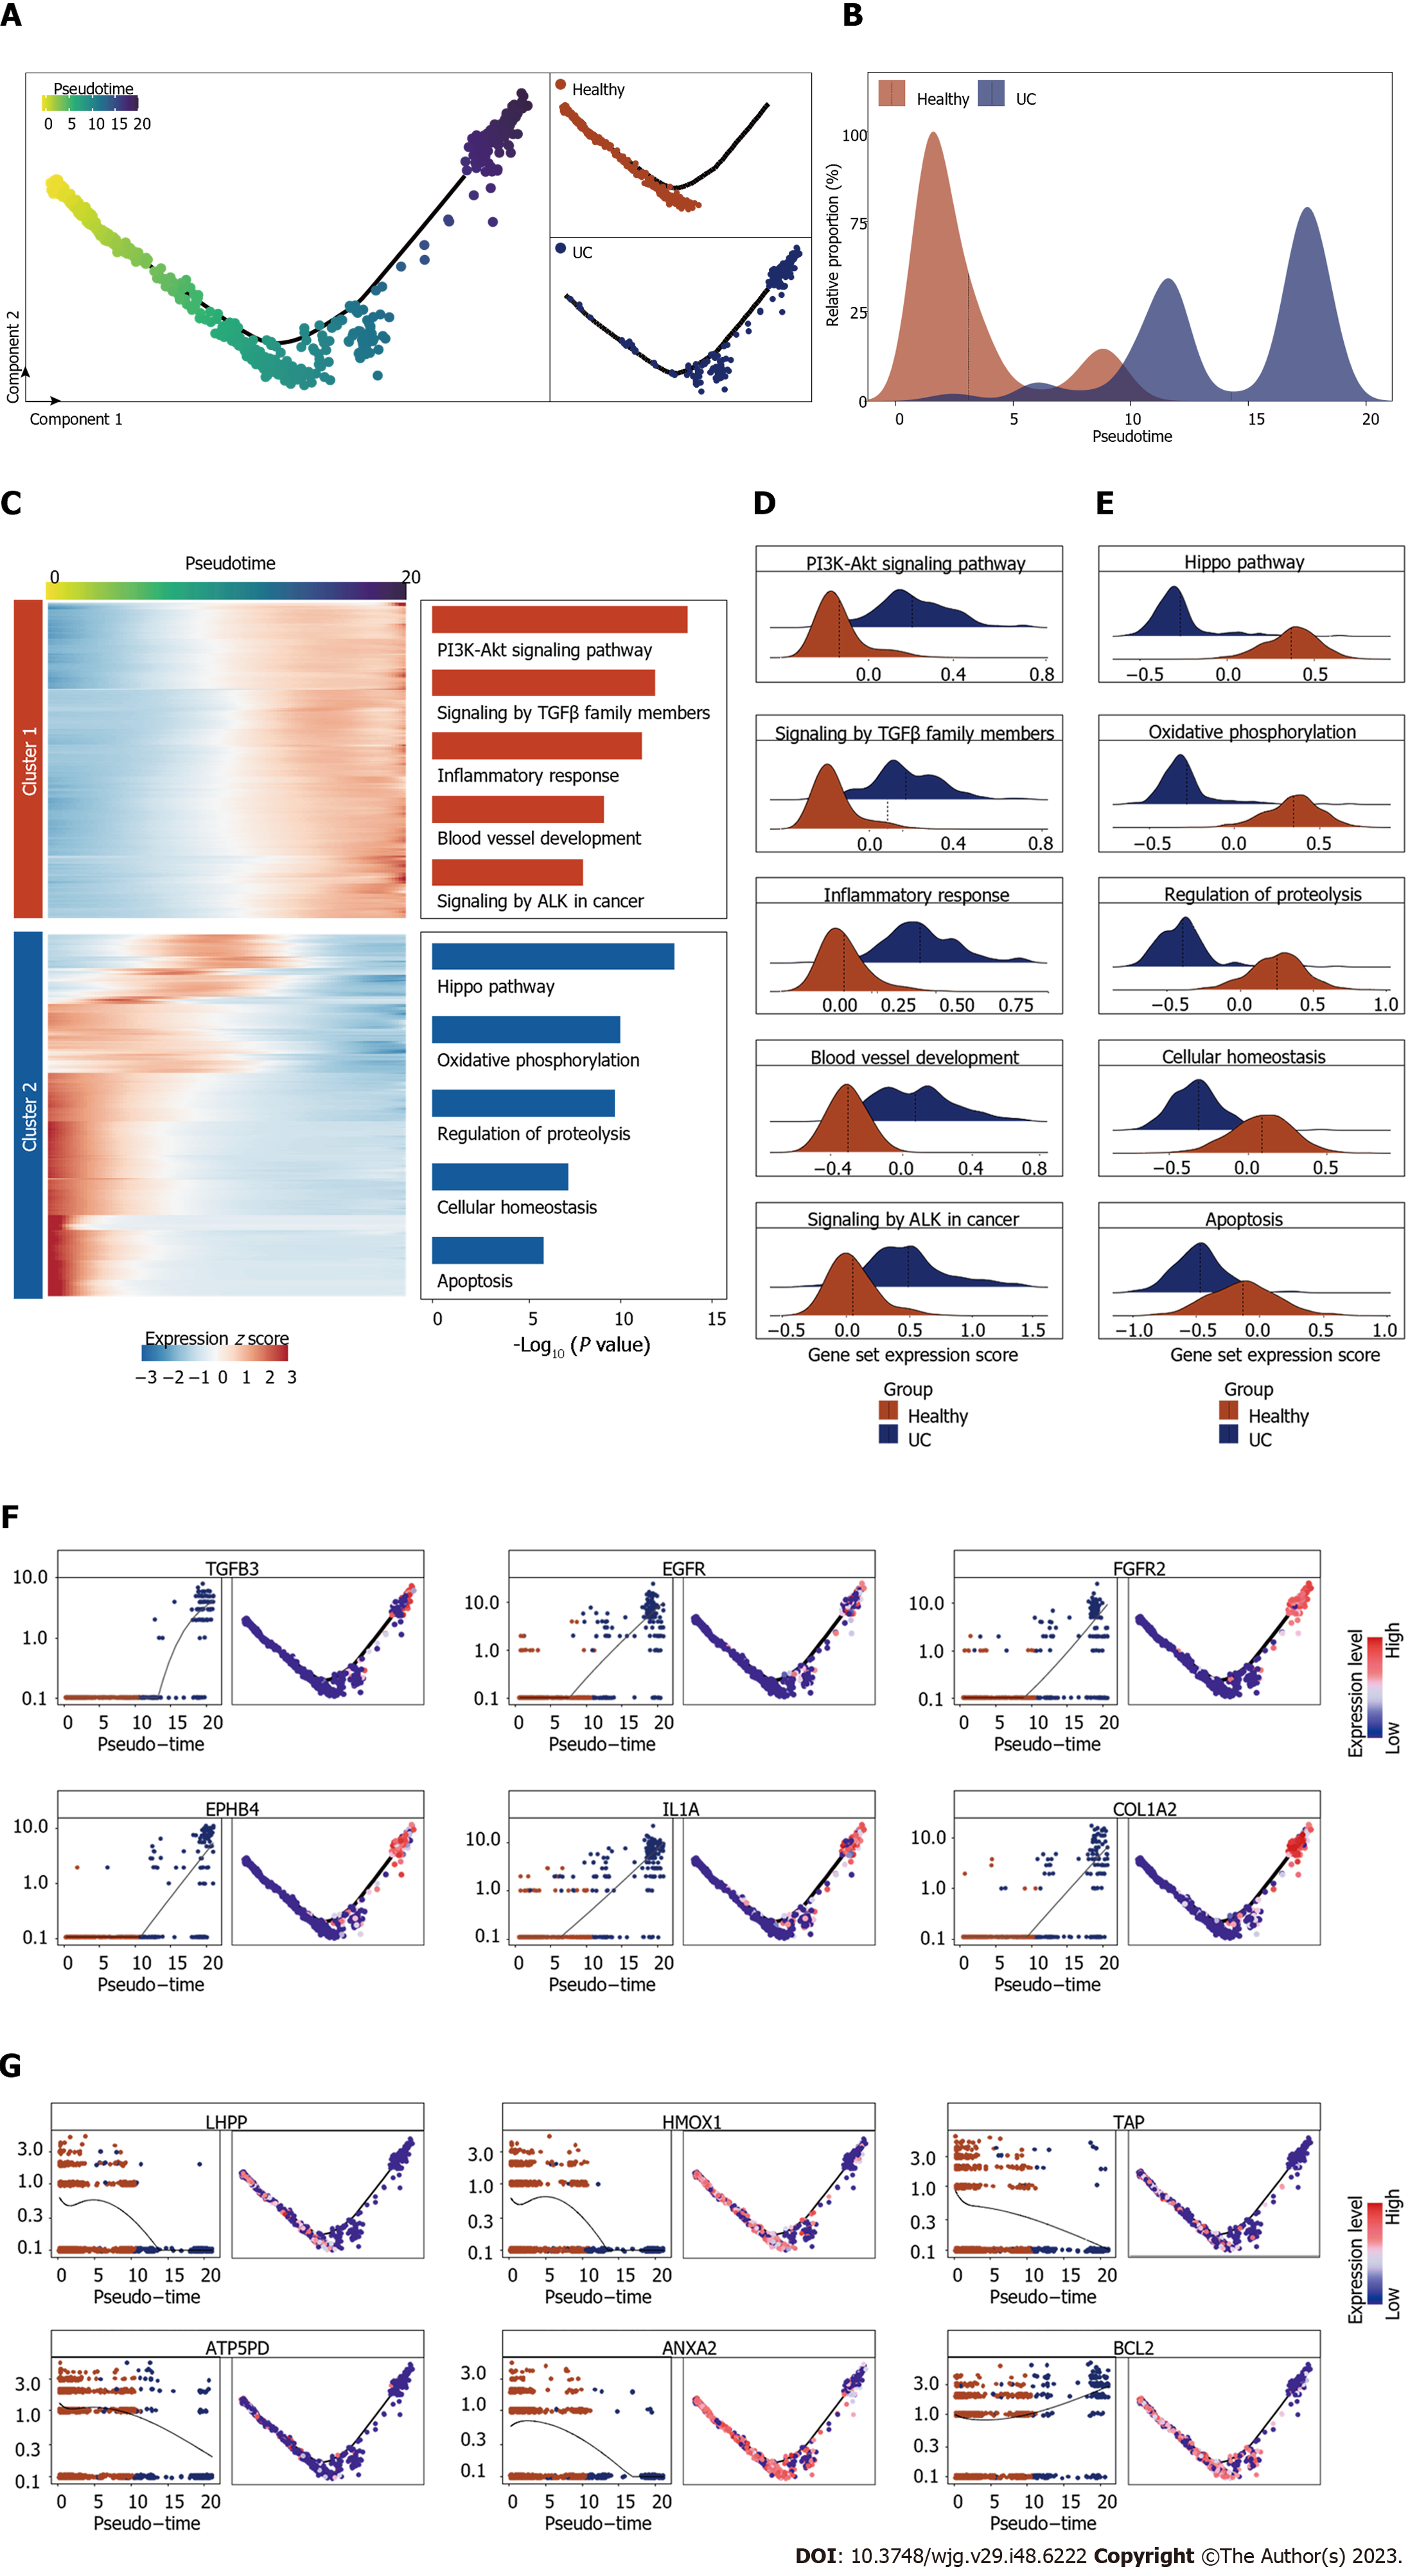
Figure 3 Cellular and molecular dynamics of endothelial cells during ulcerative colitis progression.
A: Pseudotime trajectory analysis of endothelial cell (EC). Left, pseudotime scores of EC. Top right, the distribution of ECs in healthy group. Bottom right, the distribution of ECs in ulcerative colitis group; B: Ridge plot showing the cell number distribution of EC in healthy and ulcerative colitis groups along pseudotime trajectory of Figure 3A; C: Heatmap showing the time-related gene expression profiles during ulcerative colitis, with gene function annotation on the right; D: Ridge plots showing the expression score of gene set from cluster 1 in Figure 3C of healthy and ulcerative colitis groups; E: Ridge plots showing the expression score of gene set from cluster 2 in Figure 3C of healthy and ulcerative colitis groups; F: Scatter plots and trajectory plots showing the expression level of top genes in cluster 1 of Figure 3C; G: Scatter plots and trajectory plots showing the expression level of top genes in cluster 2 of Figure 3C.
- Citation: Wang YF, He RY, Xu C, Li XL, Cao YF. Single-cell analysis identifies phospholysine phosphohistidine inorganic pyrophosphate phosphatase as a target in ulcerative colitis. World J Gastroenterol 2023; 29(48): 6222-6234
- URL: https://www.wjgnet.com/1007-9327/full/v29/i48/6222.htm
- DOI: https://dx.doi.org/10.3748/wjg.v29.i48.6222


