Copyright
©The Author(s) 2023.
World J Gastroenterol. Nov 21, 2023; 29(43): 5848-5864
Published online Nov 21, 2023. doi: 10.3748/wjg.v29.i43.5848
Published online Nov 21, 2023. doi: 10.3748/wjg.v29.i43.5848
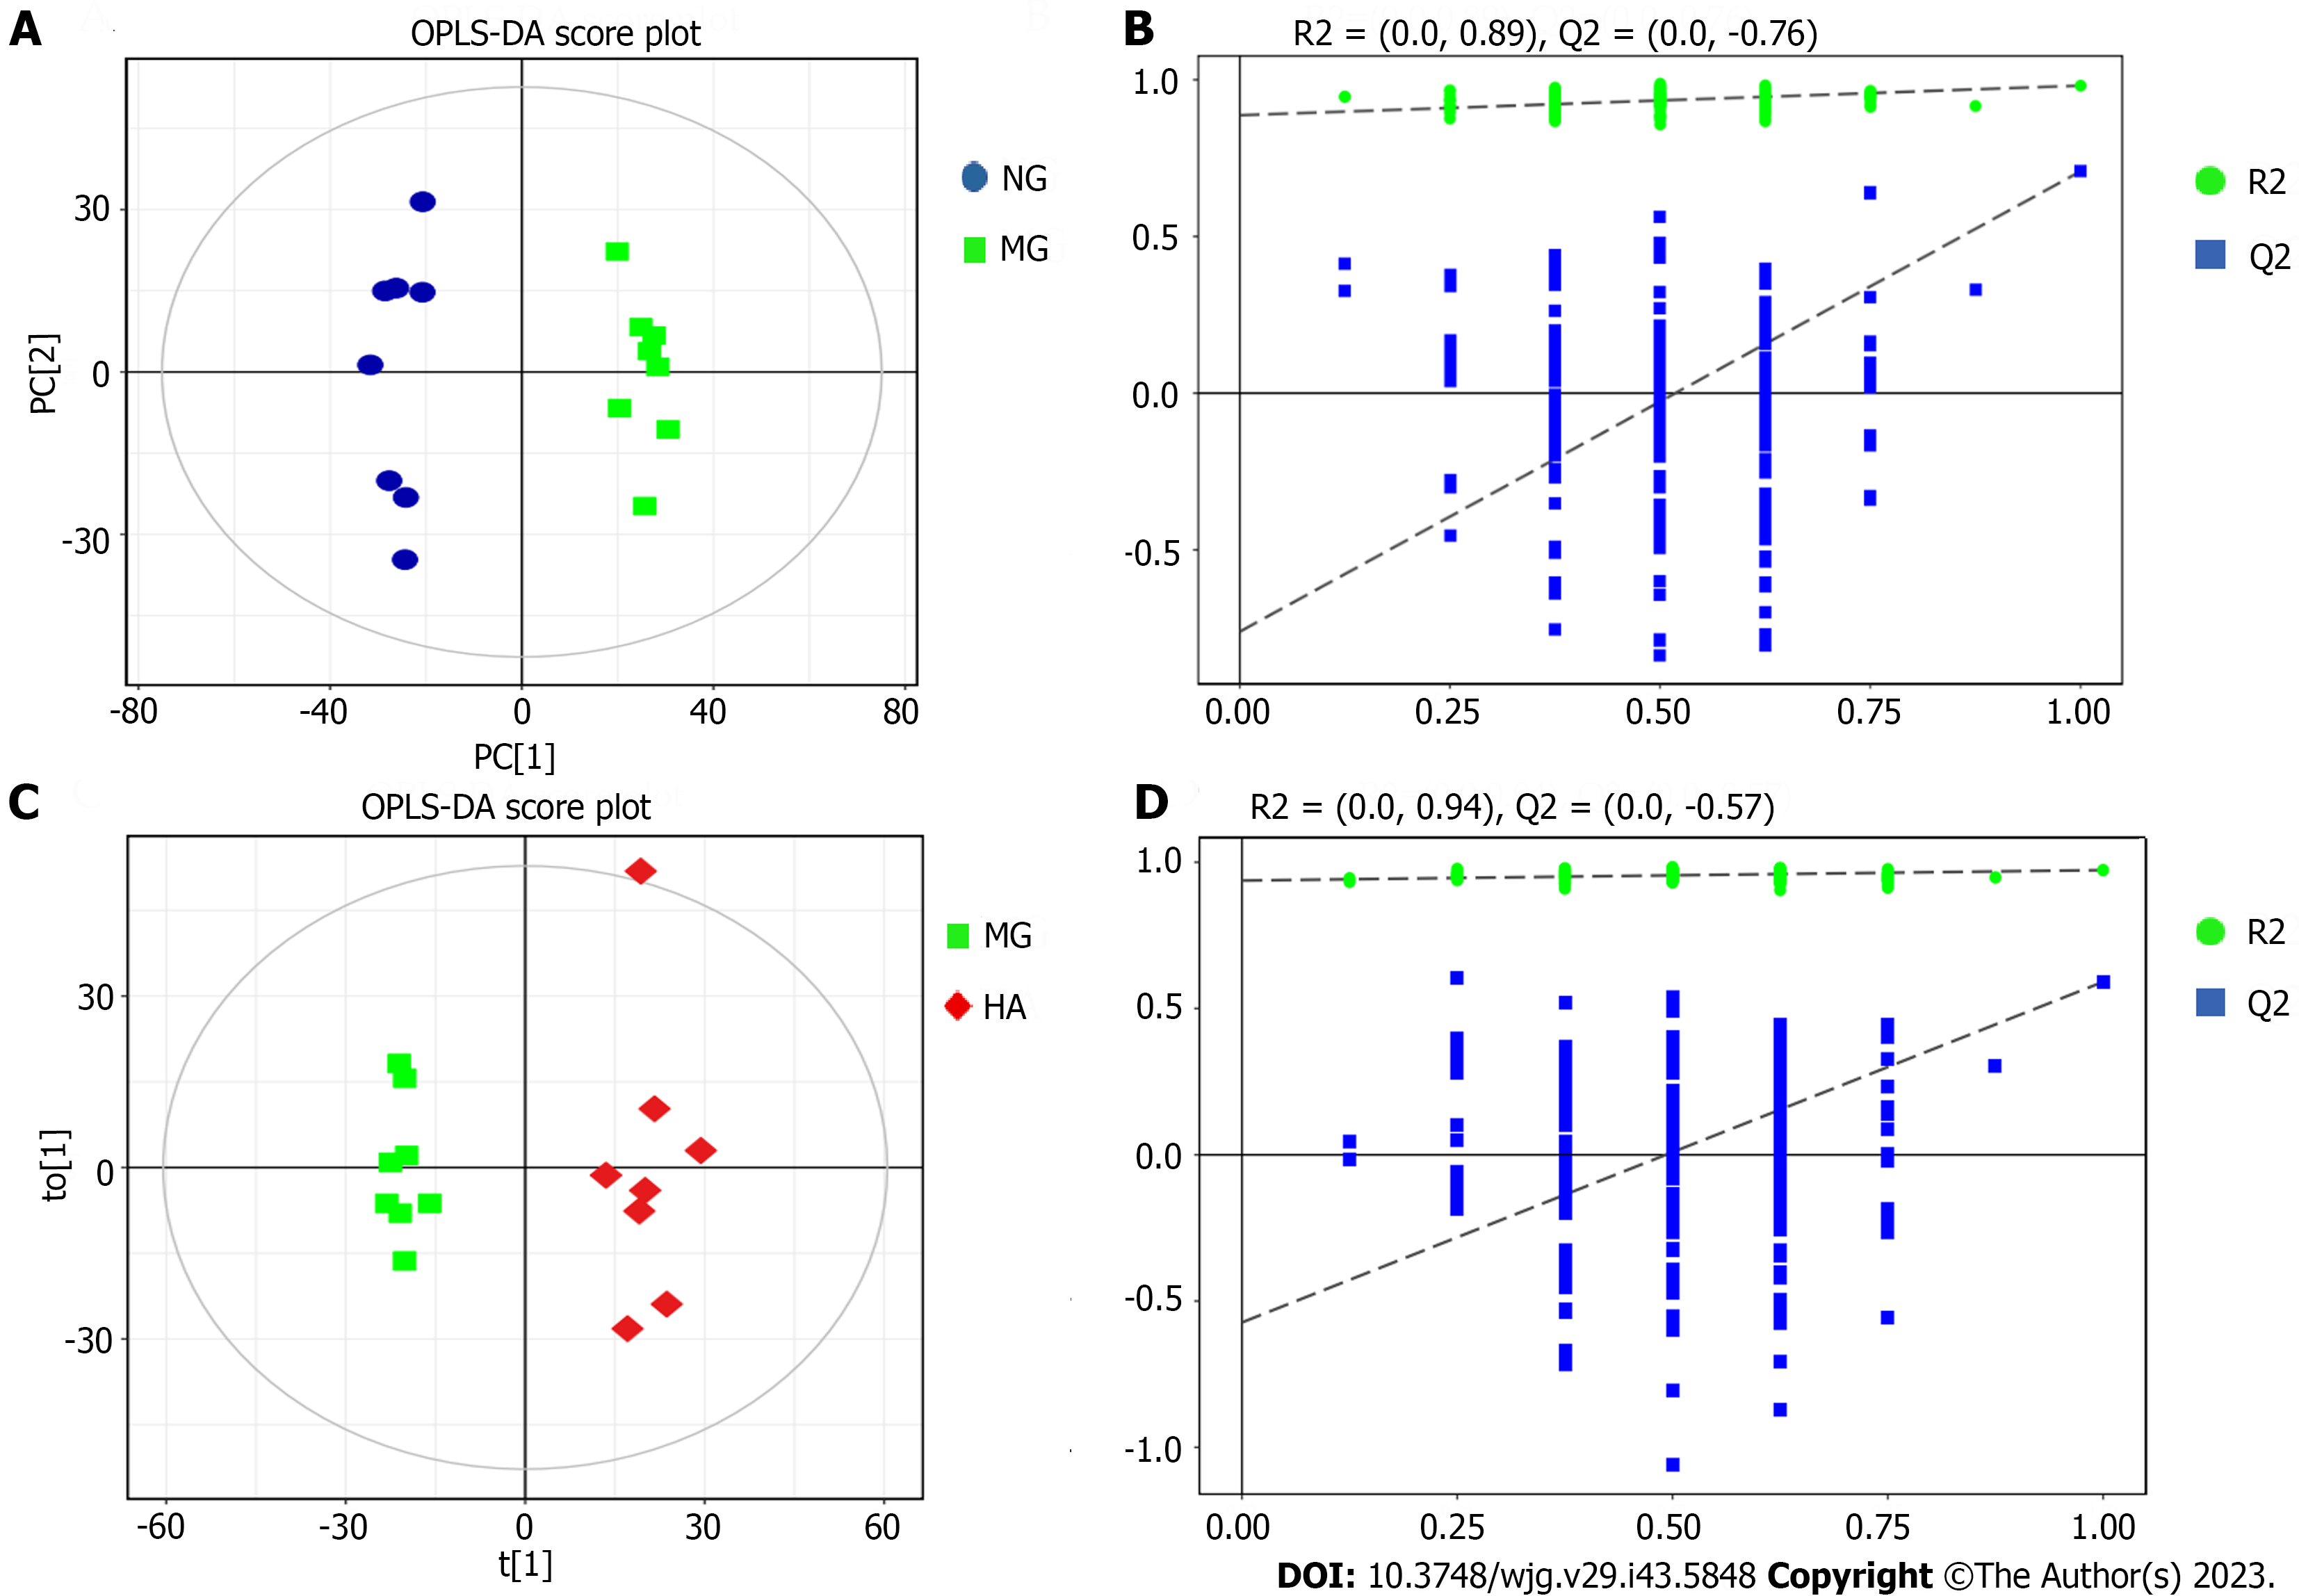
Figure 7 Orthogonal projections to latent structures-discriminant analysis score plots and 200-permutation test of plasma metabolomics analysis (n = 8).
A: Orthogonal projections to latent structures-discriminant analysis (OPLS-DA) score plots between normal group (NG) and model group (MG) groups; B: 200-permutation test between NG and MG groups; C: OPLS-DA score plots between MG and high dose group of Atractylodes japonica (HA) groups; D: 200-permutation test between MG and HA groups. OPLS-DA: Orthogonal projections to latent structures-discriminant analysis; MG: Model group; HA: High dose group of Atractylodes japonica.
- Citation: Zhen BX, Cai Q, Li F. Chemical components and protective effects of Atractylodes japonica Koidz. ex Kitam against acetic acid-induced gastric ulcer in rats. World J Gastroenterol 2023; 29(43): 5848-5864
- URL: https://www.wjgnet.com/1007-9327/full/v29/i43/5848.htm
- DOI: https://dx.doi.org/10.3748/wjg.v29.i43.5848


