Copyright
©The Author(s) 2022.
World J Gastroenterol. Jun 14, 2022; 28(22): 2494-2508
Published online Jun 14, 2022. doi: 10.3748/wjg.v28.i22.2494
Published online Jun 14, 2022. doi: 10.3748/wjg.v28.i22.2494
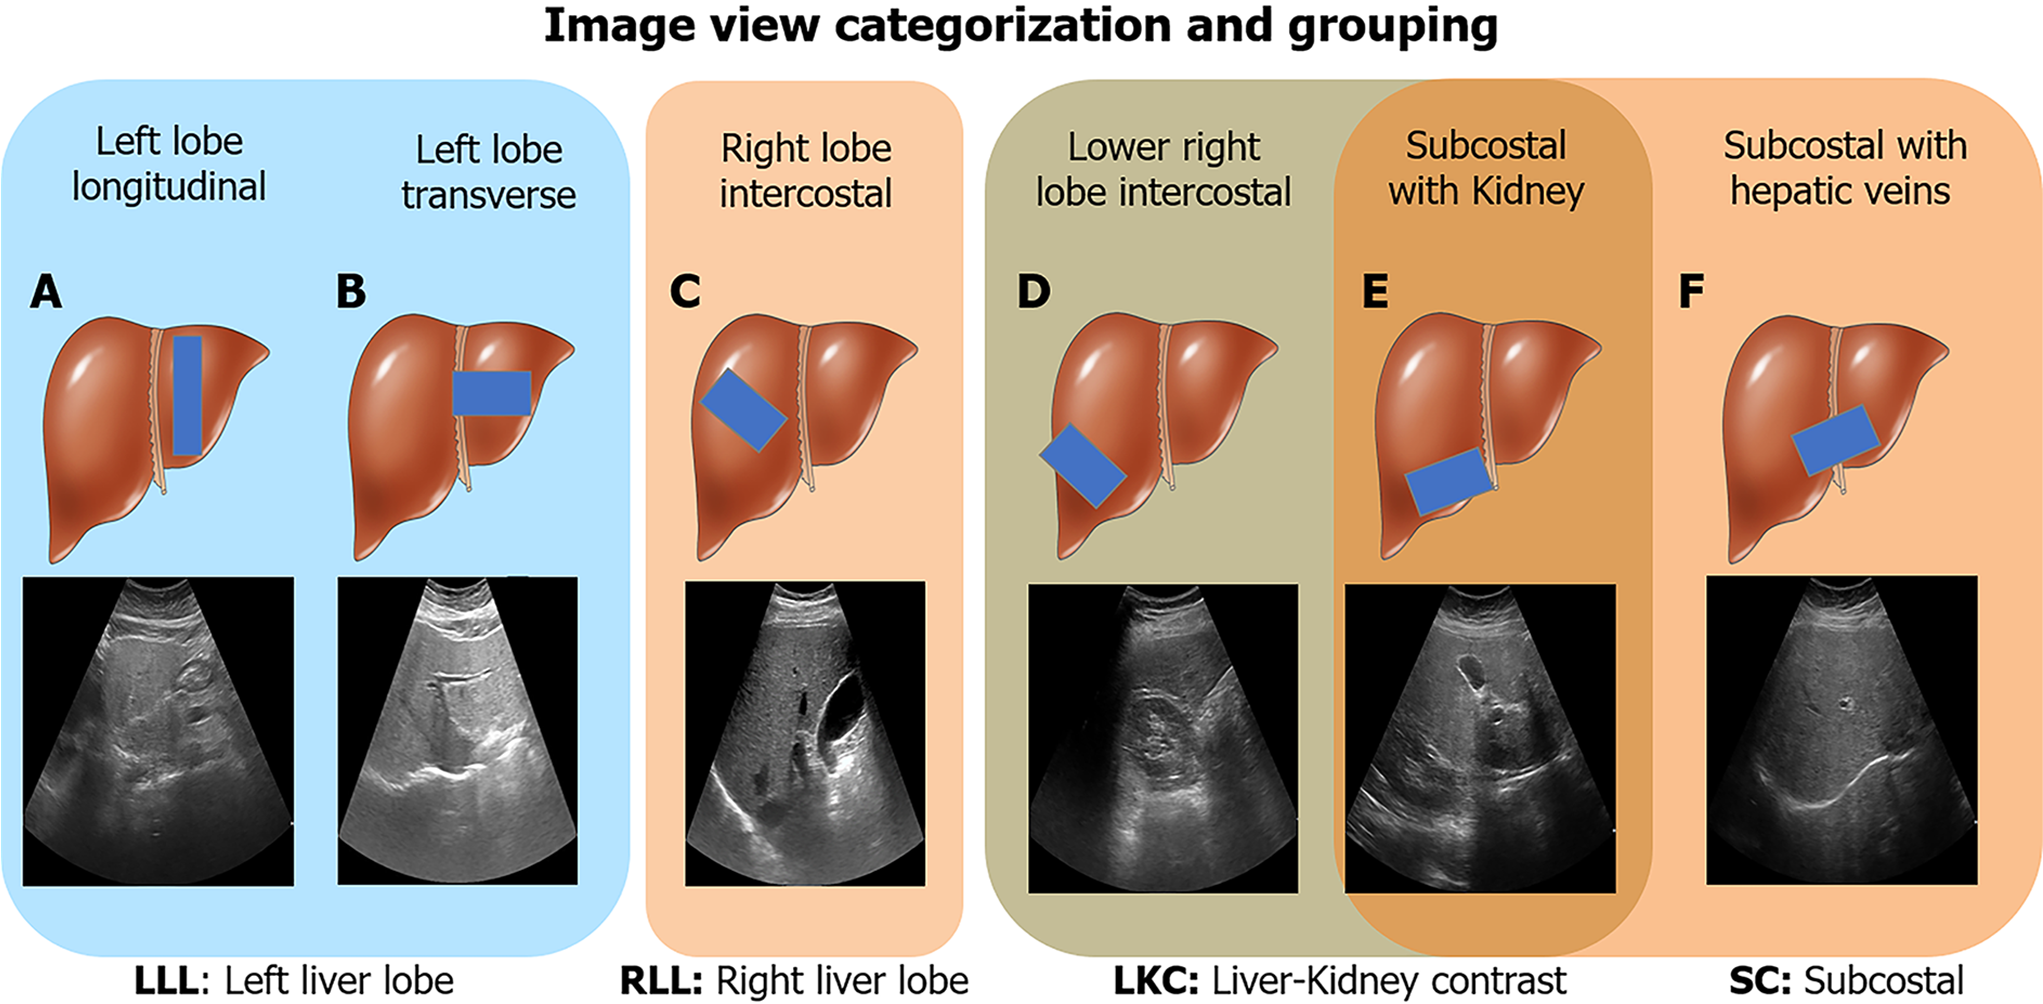
Figure 2 Image view categorization and grouping.
Six ultrasound image viewpoints were used in this study. A: Left lobe longitudinal; B: Left lobe transverse; C: Right lobe intercostal; D: Lower right lobe intercostal (depicting liver/kidney contrast); E: Subcostal depicting liver/kidney contrast; F: Subcostal with hepatic veins. These views were further categorized into four groups: Left liver lobe (A and B), right liver lobe (C), liver/kidney contrast (D and E), and subcostal (E and F). LLL: Left liver lobe; RLL: Right liver lobe; LKC: Liver/kidney contrast; SC: Subcostal. Liver cartoons adapted from the DataBase Center for Life Science (https://commons.wikimedia.org/wiki/File:201405_liver.png), licensed under the Creative Commons Attribution 4.0 International[51] (Copyright permission see Supplementary material).
- Citation: Li B, Tai DI, Yan K, Chen YC, Chen CJ, Huang SF, Hsu TH, Yu WT, Xiao J, Le L, Harrison AP. Accurate and generalizable quantitative scoring of liver steatosis from ultrasound images via scalable deep learning. World J Gastroenterol 2022; 28(22): 2494-2508
- URL: https://www.wjgnet.com/1007-9327/full/v28/i22/2494.htm
- DOI: https://dx.doi.org/10.3748/wjg.v28.i22.2494


