Copyright
©The Author(s) 2021.
World J Gastroenterol. Jan 28, 2021; 27(4): 305-320
Published online Jan 28, 2021. doi: 10.3748/wjg.v27.i4.305
Published online Jan 28, 2021. doi: 10.3748/wjg.v27.i4.305
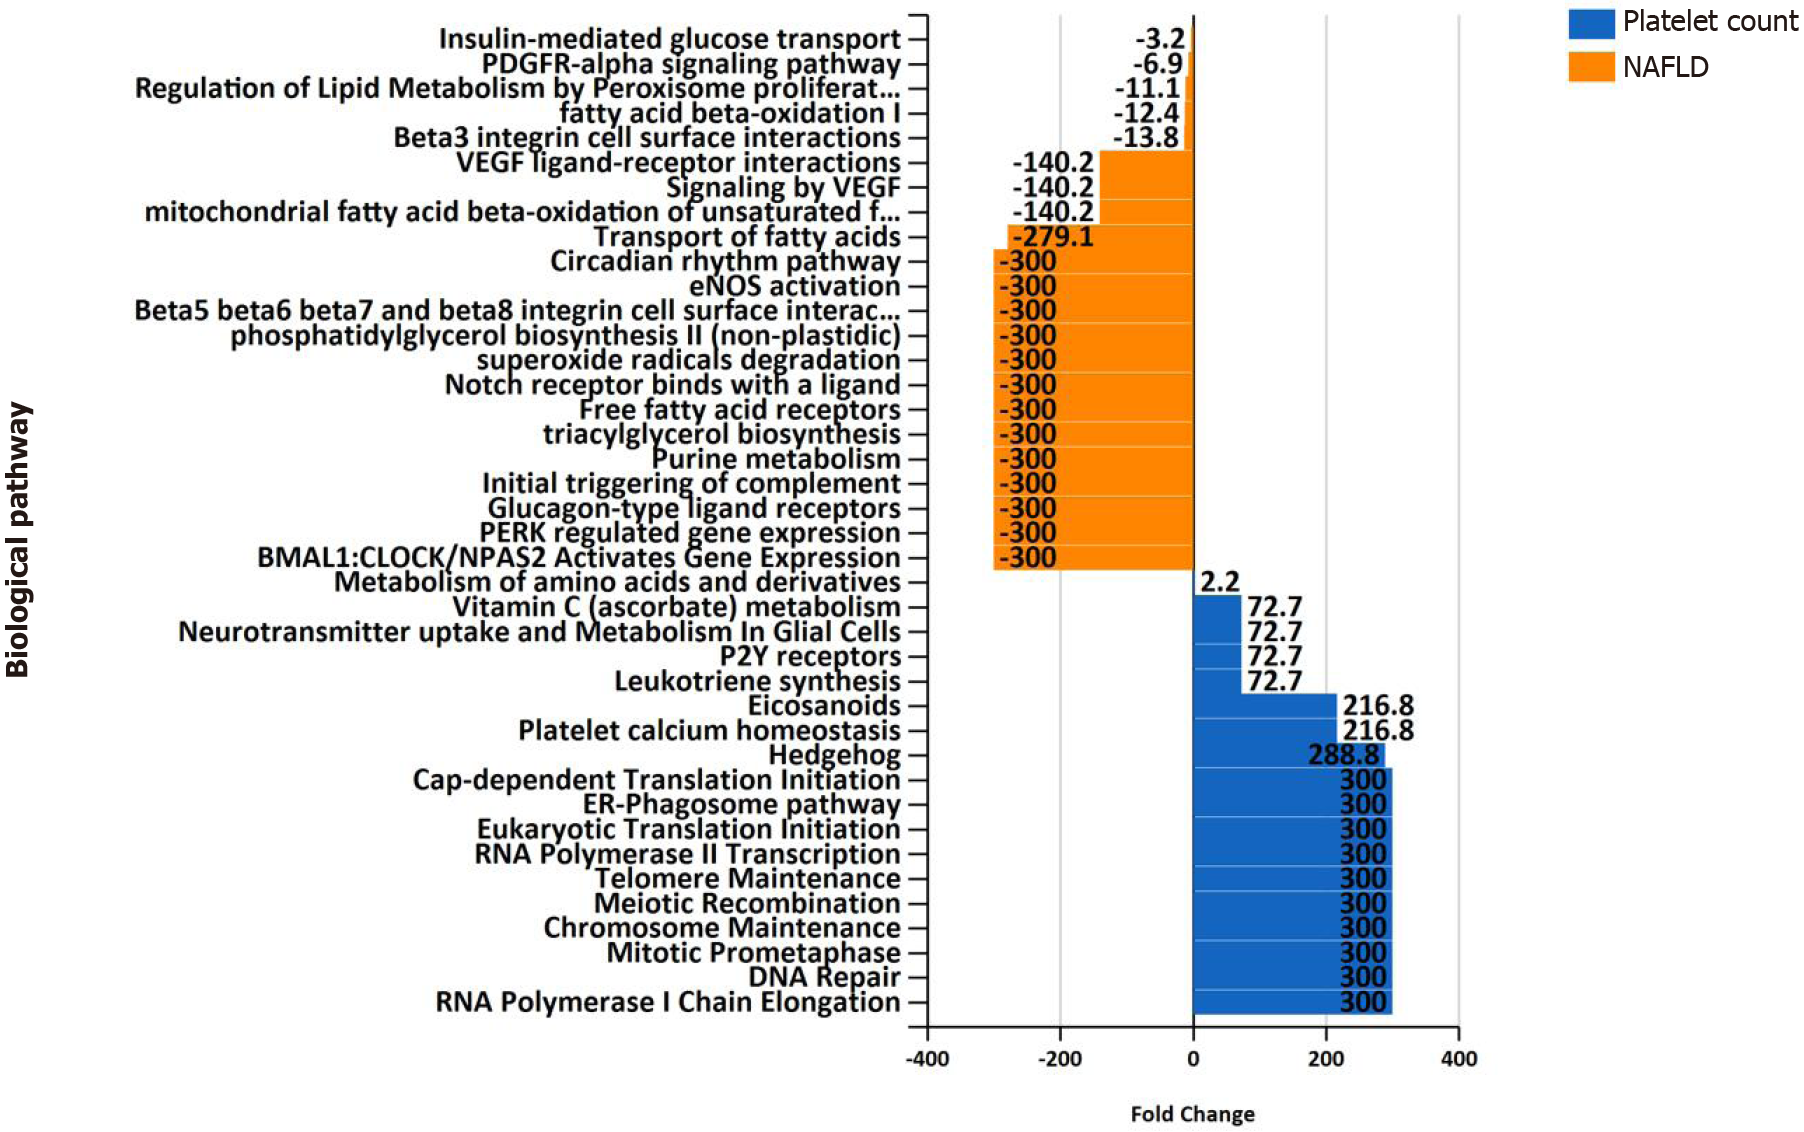
Figure 5 Overrepresentation analysis of biological pathways of genes associated with platelet count vs.
genes associated with nonalcoholic fatty liver disease. Overrepresentation analysis of biological pathways of platelet count-associated genes in comparison with that pertaining to nonalcoholic fatty liver disease-associated genes. The input list of platelet count-associated variants (P < 1 × 10⁻⁶) was generated by searching the United Kingdom Biobank genome-wide association studies database as provided by Neale’s lab resource (http://www.nealelab.is/uk-biobank/). The input list associated with nonalcoholic fatty liver disease includes 928 genes/proteins obtained by data mining[5]. The analysis was performed by applying the functional enrichment and interaction network analysis (FunRich) tool[46].
- Citation: Pirola CJ, Salatino A, Sookoian S. Pleiotropy within gene variants associated with nonalcoholic fatty liver disease and traits of the hematopoietic system. World J Gastroenterol 2021; 27(4): 305-320
- URL: https://www.wjgnet.com/1007-9327/full/v27/i4/305.htm
- DOI: https://dx.doi.org/10.3748/wjg.v27.i4.305


