Copyright
©The Author(s) 2021.
World J Gastroenterol. Jan 28, 2021; 27(4): 305-320
Published online Jan 28, 2021. doi: 10.3748/wjg.v27.i4.305
Published online Jan 28, 2021. doi: 10.3748/wjg.v27.i4.305
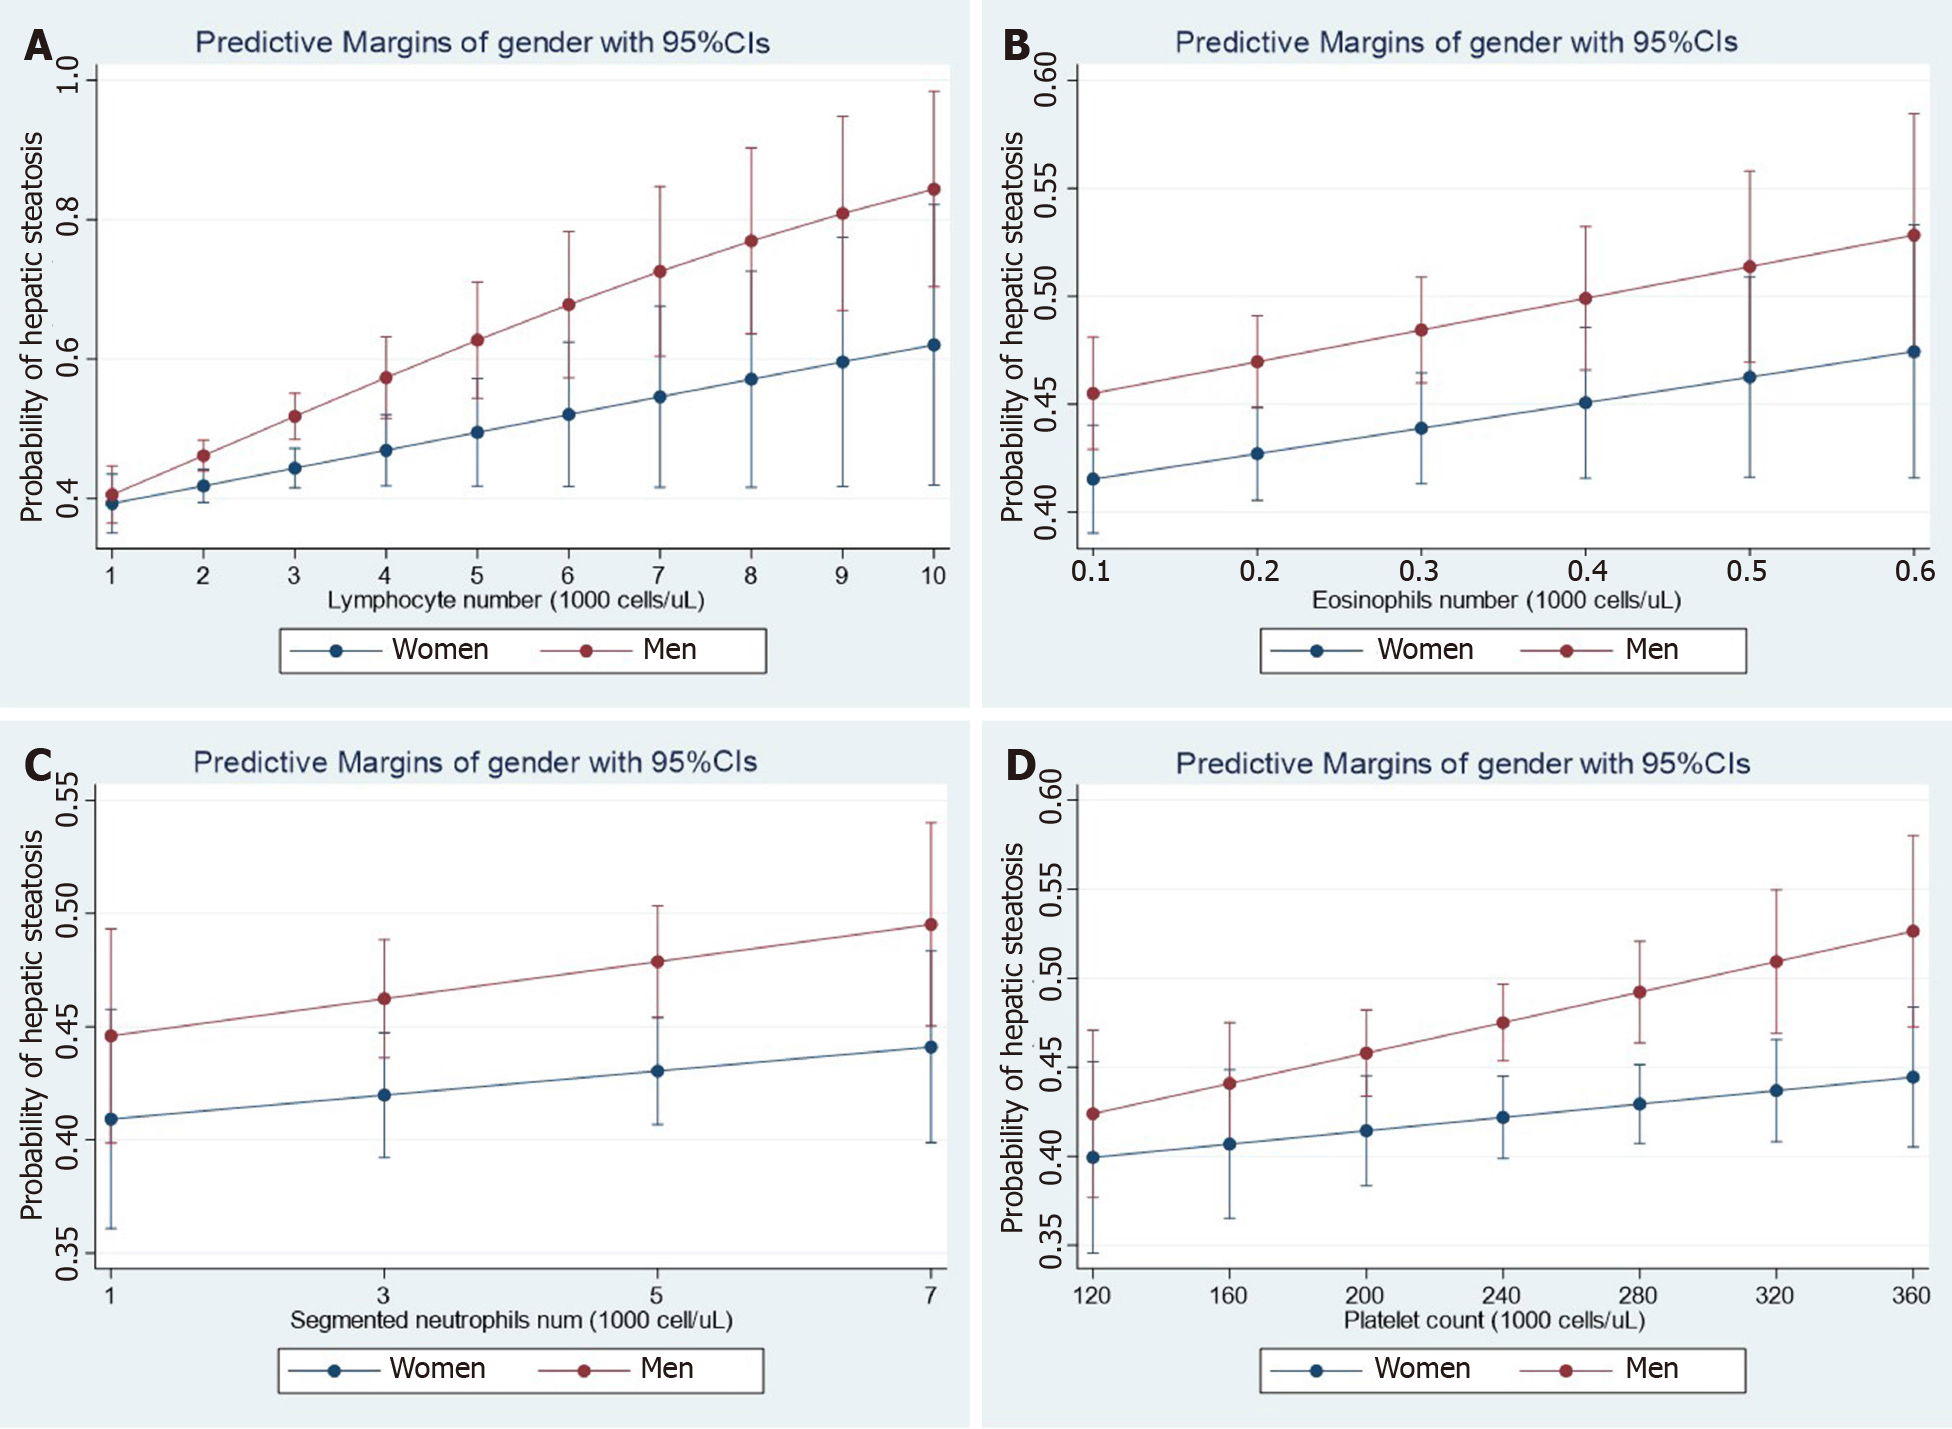
Figure 1 Steatosis and hematological traits.
Panels show the interaction effects between hepatic steatosis and hematological traits (A: Lymphocyte number; B: Eosinophil number; C: Neutrophil number; D: Platelet number) on the probability of having hepatic steatosis according to gender. Interaction analyses were performed by linear logistic regression for the presence of steatosis (no = 0, yes = 1) as the dependent variable adding an interaction term among gender (women = 0, men = 1) and the specific continuous variable. Diabetes and log-transformed age, waist, HgbA1c, total cholesterol, systolic blood pressure, and triglycerides were also included as cofactors. The probability of liver fibrosis was estimated by margins as implemented in the STATA software. Data analysis was based on National Health and Nutrition Examination Surveys 2017-2018; the National Center for Health Statistics Research Ethics Review Board approved the National Health and Nutrition Examination Surveys protocol, and participants gave informed consent. Datasets and further information are available online (https://www.cdc.gov/nchs/nhanes/index.htm). Liver steatosis was defined by the controlled attenuation parameter[12]. Only participants that consumed less than 30 g and 20 g of alcohol for men and women, respectively, were included in the present analysis. Those participants with positive tests for viral hepatitis were excluded.
- Citation: Pirola CJ, Salatino A, Sookoian S. Pleiotropy within gene variants associated with nonalcoholic fatty liver disease and traits of the hematopoietic system. World J Gastroenterol 2021; 27(4): 305-320
- URL: https://www.wjgnet.com/1007-9327/full/v27/i4/305.htm
- DOI: https://dx.doi.org/10.3748/wjg.v27.i4.305


