Copyright
©The Author(s) 2019.
World J Gastroenterol. Jul 7, 2019; 25(25): 3218-3230
Published online Jul 7, 2019. doi: 10.3748/wjg.v25.i25.3218
Published online Jul 7, 2019. doi: 10.3748/wjg.v25.i25.3218
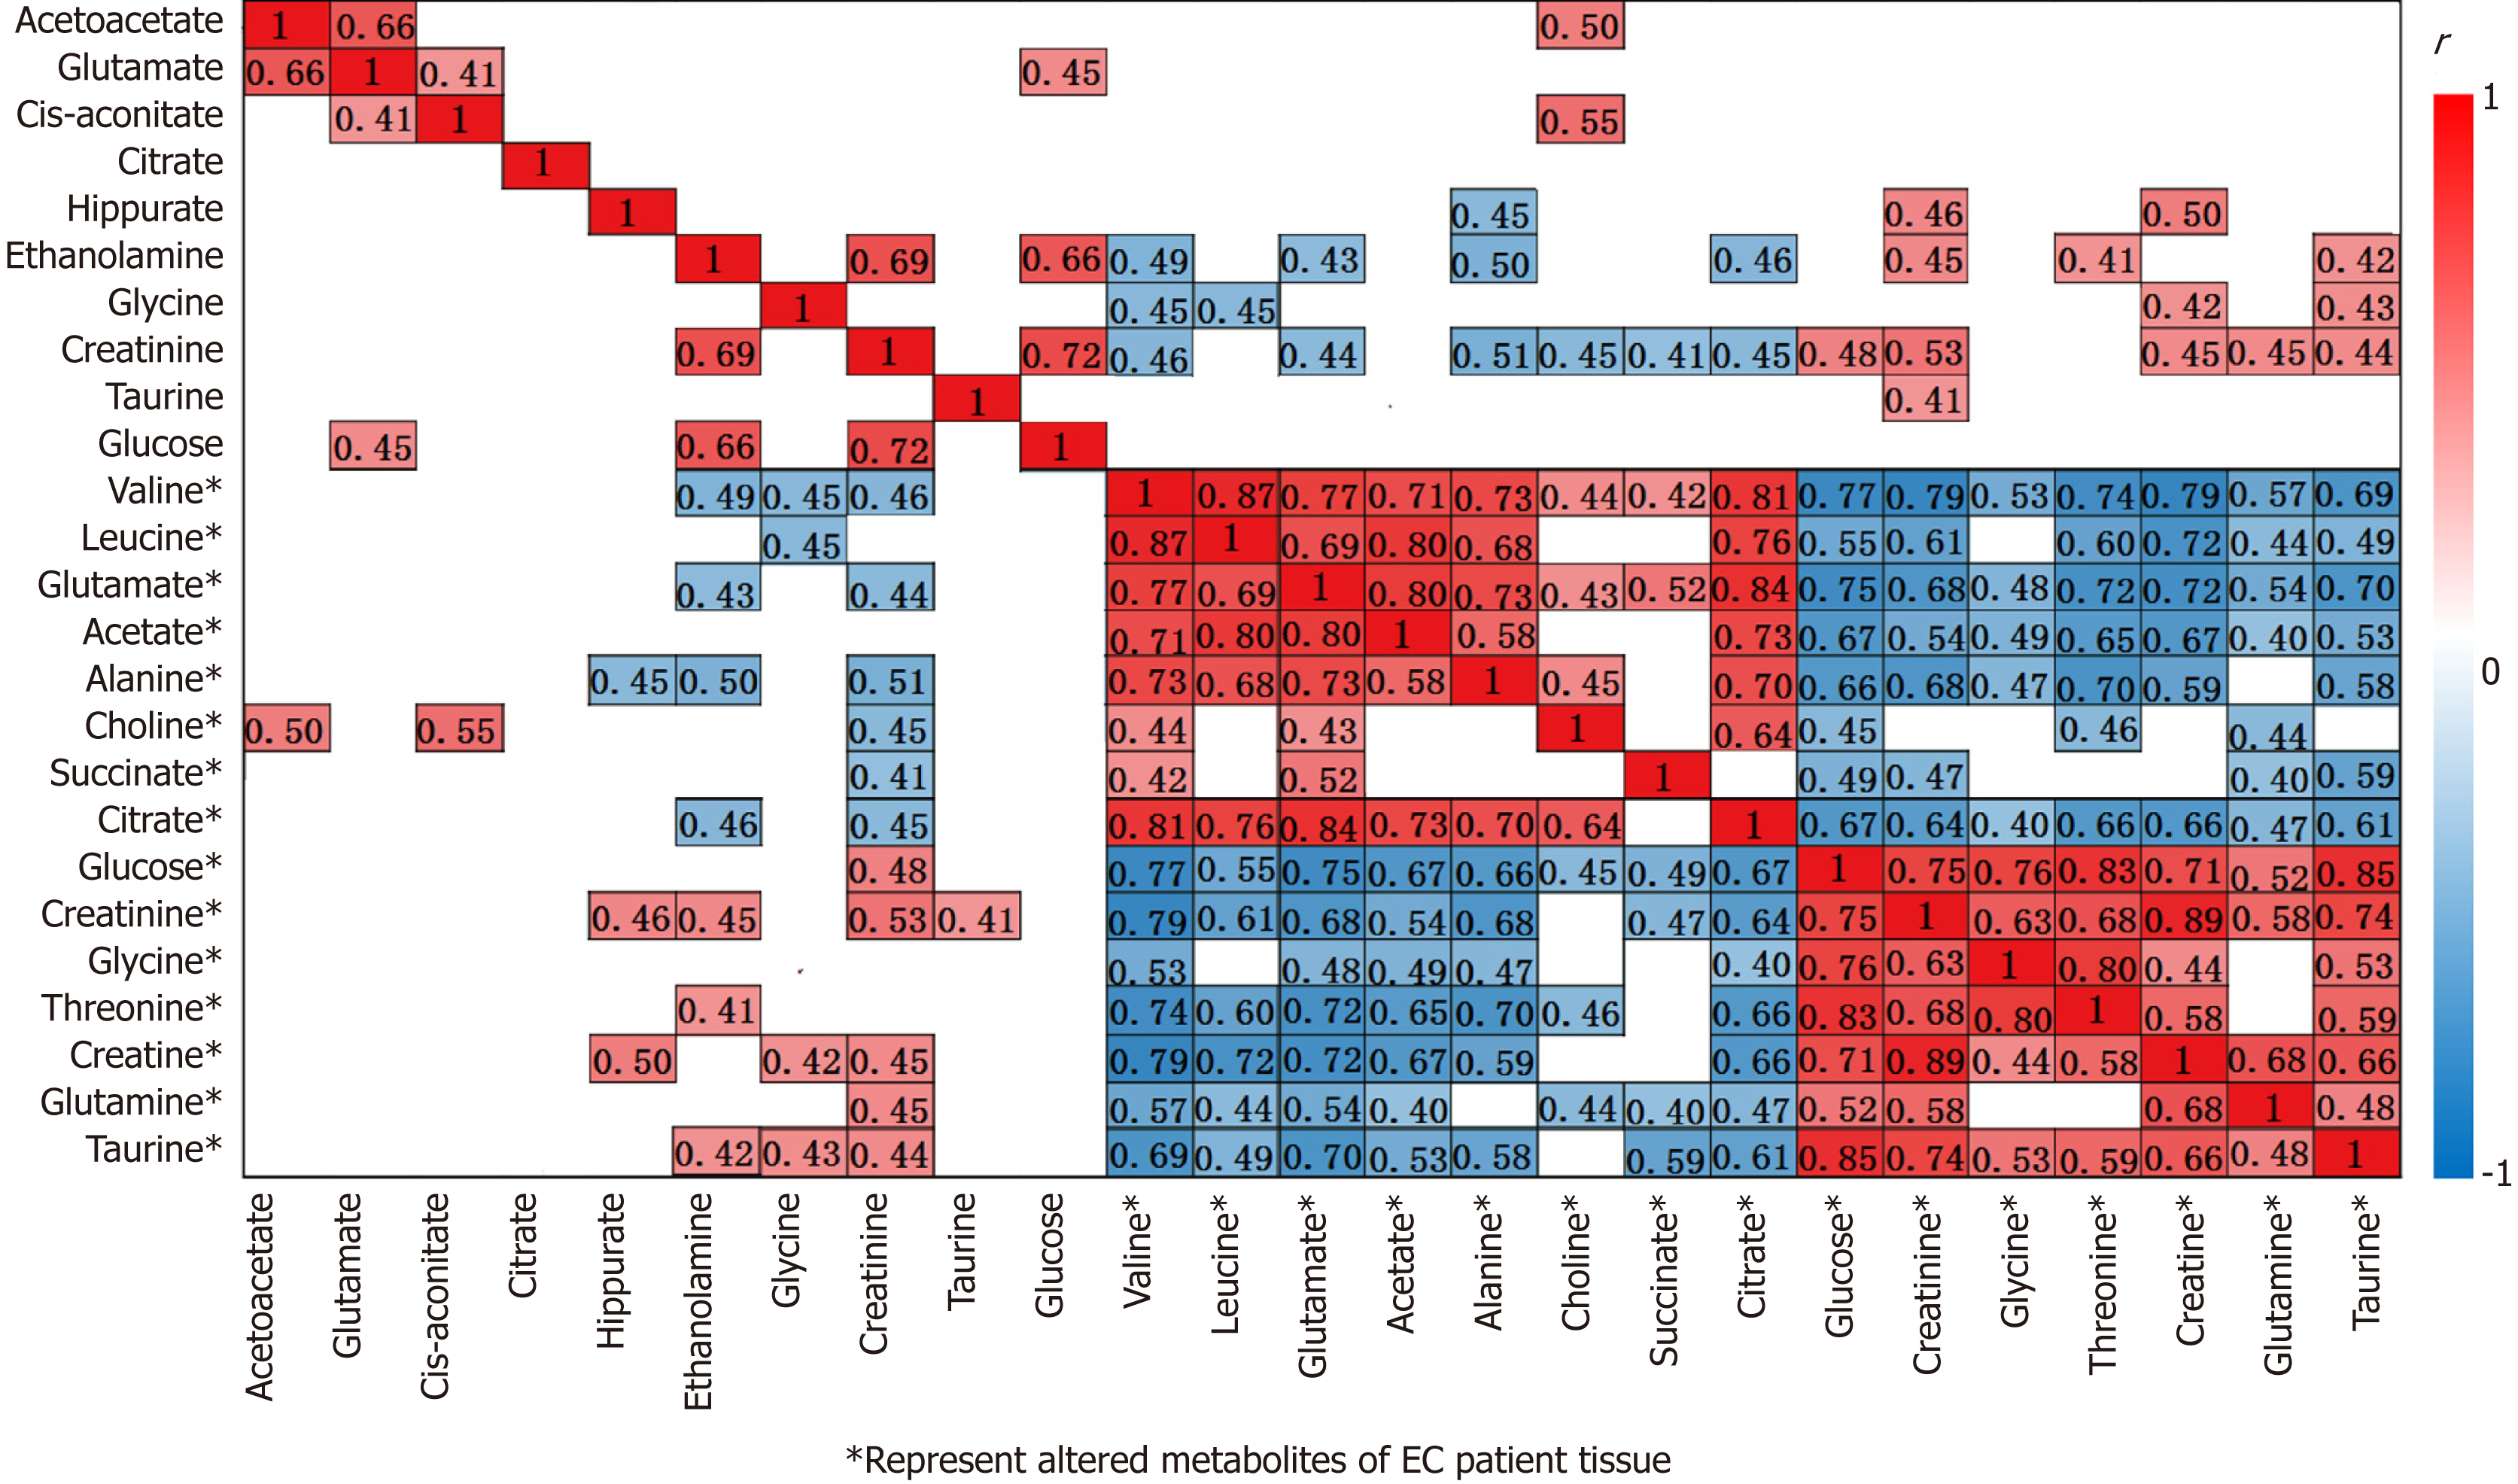
Figure 3 Correlation heat map color-coded by the strength of Spearman correlation coefficients (r) between metabolites found to be important in tumor versus control discrimination.
Cut-off values of |r| > 0.4 and P < 0.05 have been used. The metabolites used are those listed in Tables 2 and 3 (metabolites labeled with “*” noted as tissue biomarkers). Red boxes indicate positive associations, and blue boxes indicate negative associations.
- Citation: Liang JH, Lin Y, Ouyang T, Tang W, Huang Y, Ye W, Zhao JY, Wang ZN, Ma CC. Nuclear magnetic resonance-based metabolomics and metabolic pathway networks from patient-matched esophageal carcinoma, adjacent noncancerous tissues and urine. World J Gastroenterol 2019; 25(25): 3218-3230
- URL: https://www.wjgnet.com/1007-9327/full/v25/i25/3218.htm
- DOI: https://dx.doi.org/10.3748/wjg.v25.i25.3218


