Copyright
©The Author(s) 2019.
World J Gastroenterol. May 28, 2019; 25(20): 2402-2415
Published online May 28, 2019. doi: 10.3748/wjg.v25.i20.2402
Published online May 28, 2019. doi: 10.3748/wjg.v25.i20.2402
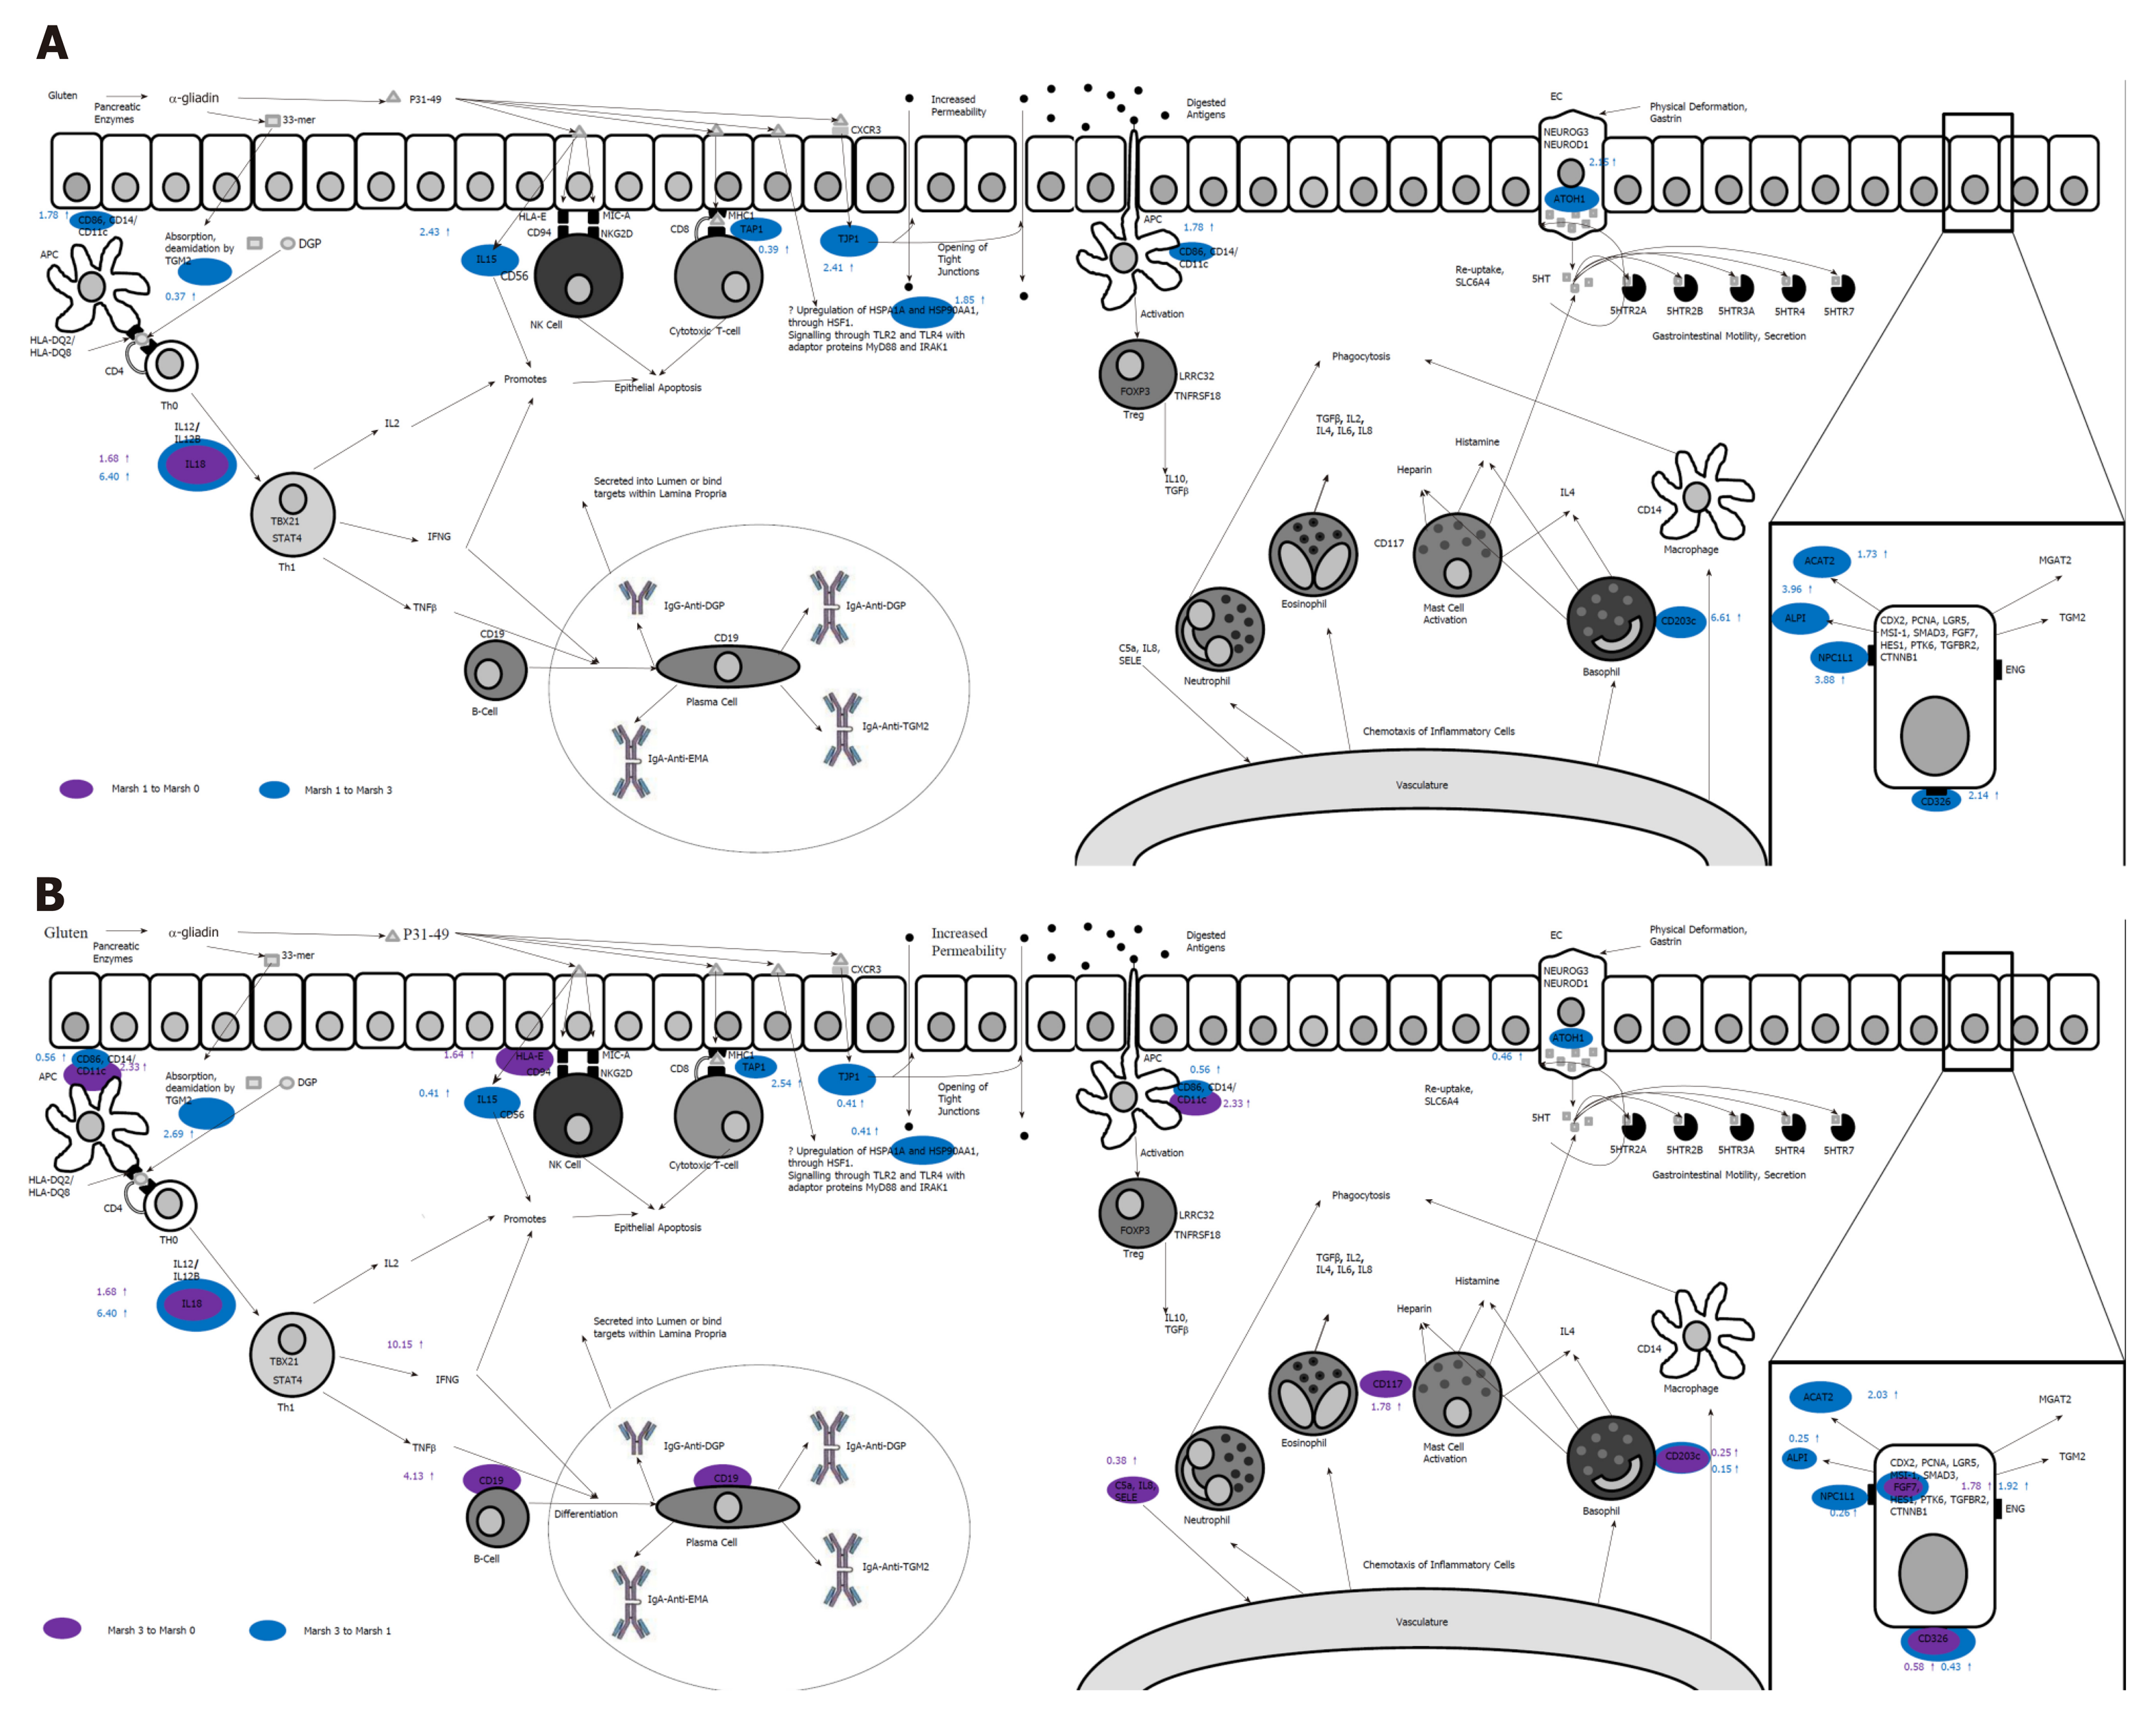
Figure 2 Comparative gene expression signatures of Marsh type 1 and Marsh type 3 coeliac mucosa.
This diagram shows the changes which occur in mRNA expression of key proteins involved in the immunopathology of coeliac disease. In Marsh type 1 mucosa (A), it can be seen that the expression of innate immune markers is activated first when compared to Marsh 0 and Marsh 3 tissue (purple and blue respectively), with an influx of basophils (CD203c), increased expression of IL18 and IL15, as well as increased expression of heat shock protein (HSPA1A). In Marsh type 3 mucosa (B), an adaptive immune response predominates with a Th1 immune reaction, with increased expression of IFNG and CD19 (B-cells). Numbers indicate fold-change gene expression between groups (i.e., Marsh type 1 compared to Marsh type 0), adapted from work presented in[60].
- Citation: Charlesworth RP, Marsh MN. From 2-dimensional to 3-dimensional: Overcoming dilemmas in intestinal mucosal interpretation. World J Gastroenterol 2019; 25(20): 2402-2415
- URL: https://www.wjgnet.com/1007-9327/full/v25/i20/2402.htm
- DOI: https://dx.doi.org/10.3748/wjg.v25.i20.2402


