Copyright
©The Author(s) 2019.
World J Gastroenterol. May 14, 2019; 25(18): 2188-2203
Published online May 14, 2019. doi: 10.3748/wjg.v25.i18.2188
Published online May 14, 2019. doi: 10.3748/wjg.v25.i18.2188
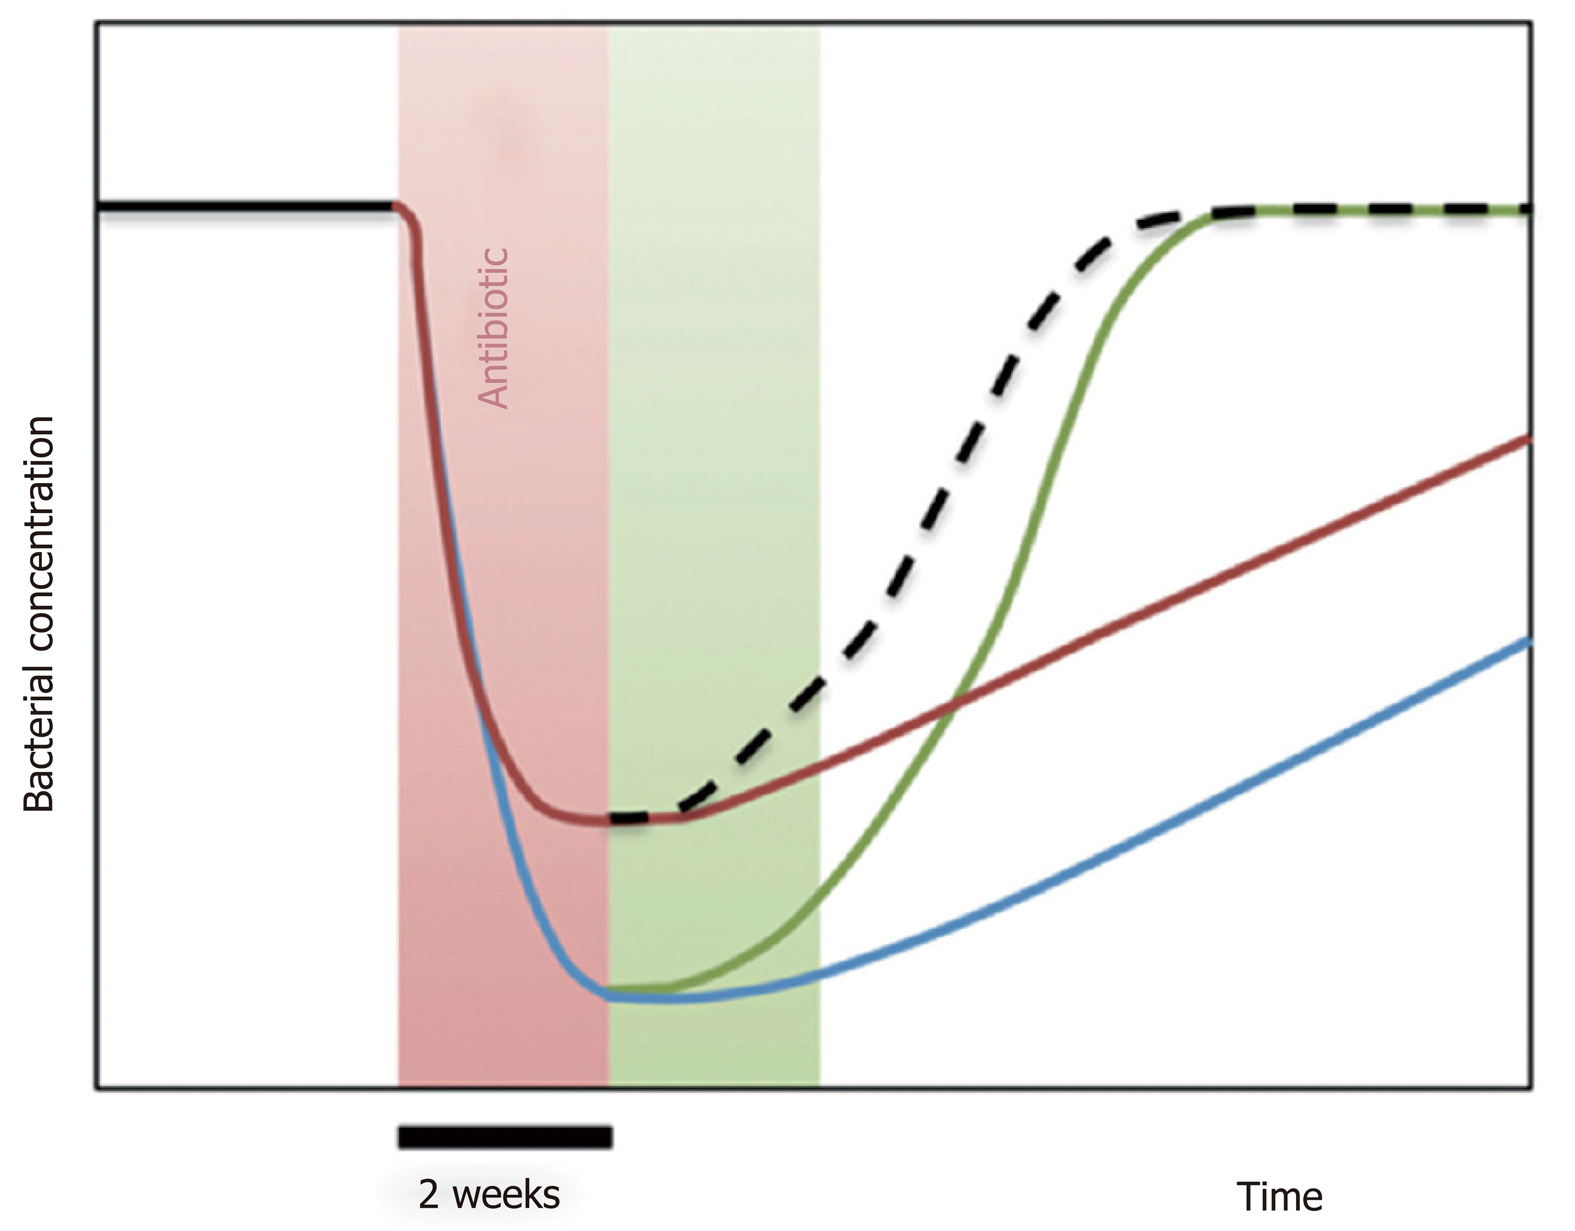
Figure 8 Diagram illustrating the impact of Saccharomyces boulardii CNCM I-745 on dysbiosis during antibiotic therapy.
A 2-wk treatment with antibiotics (red zone of the graph) induces a sudden decrease in the dominant bacterial populations of the microbiota (blue curve). Treatment with Saccharomyces boulardii CNCM I-745 during antibiotic therapy (red curve) reduces the sudden decrease in bacterial populations. When S. boulardii CNCM I-745 is administered after antibiotic therapy (green zone of the graph, green curve) the yeast accelerates the restoration of the intestinal flora to its initial level. An optimal use of yeast would be administration during and after antibiotic therapy, which is presented by the hatched curve resulting from the red and green curve (from reference[75]).
- Citation: Czerucka D, Rampal P. Diversity of Saccharomyces boulardii CNCM I-745 mechanisms of action against intestinal infections. World J Gastroenterol 2019; 25(18): 2188-2203
- URL: https://www.wjgnet.com/1007-9327/full/v25/i18/2188.htm
- DOI: https://dx.doi.org/10.3748/wjg.v25.i18.2188


