Copyright
©The Author(s) 2018.
World J Gastroenterol. Jan 28, 2018; 24(4): 511-518
Published online Jan 28, 2018. doi: 10.3748/wjg.v24.i4.511
Published online Jan 28, 2018. doi: 10.3748/wjg.v24.i4.511
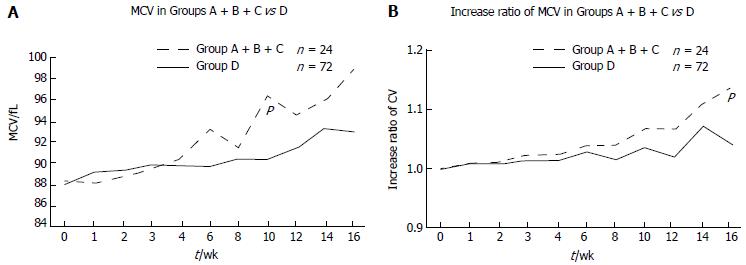
Figure 4 Effect of thipourine on mean corpuscular volume.
A: MCV in Groups A + B + C vs D. MCV increased after starting 6MP in both the mutant (Group A + B + C) and the wild cases (Group D, Figure 4). MCV was significantly higher at 10 wk in the mutant than the wild cases (P = 0.0085); B: Increase ratio of MCV in Groups A + B + C vs D. The increase rate was higher in the variants than the wild and statistically significant at 16 wk (P = 0.00198). We set 1.0 as the MCV at the beginning of thiopurines. 6MP: 6-mercaptopurine; MCV: Mean corpuscular volume.
- Citation: Kojima Y, Hirotsu Y, Omata W, Sugimori M, Takaoka S, Ashizawa H, Nakagomi K, Yoshimura D, Hosoda K, Suzuki Y, Mochizuki H, Omata M. Influence of NUDT15 variants on hematological pictures of patients with inflammatory bowel disease treated with thiopurines. World J Gastroenterol 2018; 24(4): 511-518
- URL: https://www.wjgnet.com/1007-9327/full/v24/i4/511.htm
- DOI: https://dx.doi.org/10.3748/wjg.v24.i4.511


