Copyright
©The Author(s) 2016.
World J Gastroenterol. Dec 21, 2016; 22(47): 10325-10340
Published online Dec 21, 2016. doi: 10.3748/wjg.v22.i47.10325
Published online Dec 21, 2016. doi: 10.3748/wjg.v22.i47.10325
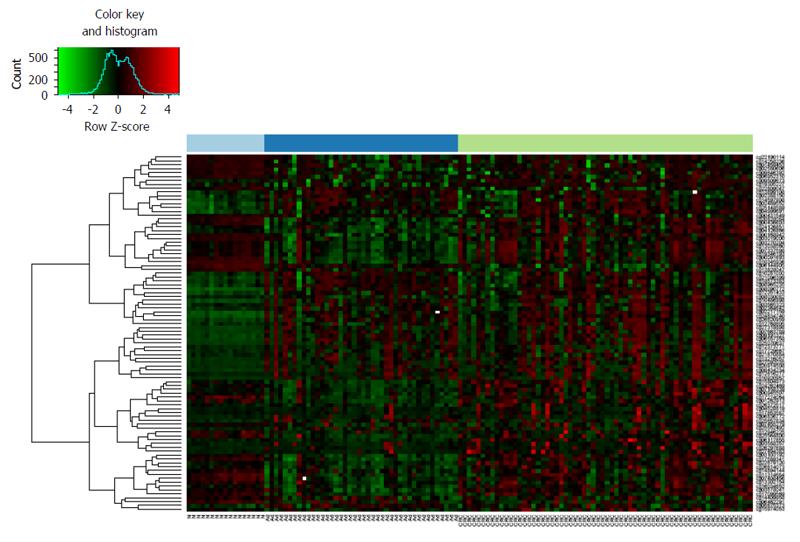
Figure 1 DNA methylation heatmap of normal, adenoma and colorectal carcinoma samples according to the methylation status of age-related CpG sites.
From the 353 epigenetic clock CpG sites (cg IDs)[2] significantly differentially methylated in CRC vs normal, adenoma vs normal and CRC vs adenoma comparisons were selected and colonic tissue samples (GSE48684[24]) were classified according to their methylation levels. The analyzed samples are illustrated on X axis, significantly altered CpG sites (cg IDs) are represented on Y axis. DNA methylation intensities (β values) are visualized, red shows hypermethylation, while hypomethylation was marked with green color. CRC: Colorectal carcinoma (light green); Ad: Adenoma (dark blue); N: Normal (light blue).
- Citation: Galamb O, Kalmár A, Barták BK, Patai &V, Leiszter K, Péterfia B, Wichmann B, Valcz G, Veres G, Tulassay Z, Molnár B. Aging related methylation influences the gene expression of key control genes in colorectal cancer and adenoma. World J Gastroenterol 2016; 22(47): 10325-10340
- URL: https://www.wjgnet.com/1007-9327/full/v22/i47/10325.htm
- DOI: https://dx.doi.org/10.3748/wjg.v22.i47.10325


