Copyright
©The Author(s) 2016.
World J Gastroenterol. Nov 28, 2016; 22(44): 9844-9852
Published online Nov 28, 2016. doi: 10.3748/wjg.v22.i44.9844
Published online Nov 28, 2016. doi: 10.3748/wjg.v22.i44.9844
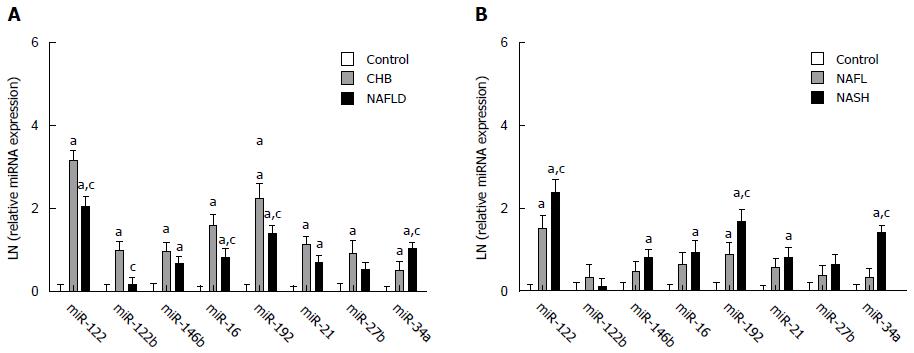
Figure 2 Serum miRNA expression profile among control (A), chronic hepatitis B and non-alcoholic fatty liver disease patients, as well as control (B), non-alcoholic fatty liver and non-alcoholic steatohepatitis patients.
All eight miRNAs, except miR-125 and -27b, were up-regulated in the non-alcoholic fatty liver disease (NAFLD) group compared with the control group (P < 0.05), with miR-34a being even higher and miR-122, -16 and -192 being lower in the NAFLD group compared with chronic hepatitis B (CHB) group (P < 0.01; Figure 2A). Among the miRNAs, miR-122, -192 and -34a showed significant differences not only between the NAFLD and the control groups but also between the non-alcoholic steatohepatitis (NASH) and the non-alcoholic fatty liver (NAFL) groups (P < 0.001; Figure 2B). aP < 0.05 vs the control group; A: cP < 0.05 vs the CHB group; B: cP < 0.05 vs the NAFL group.
- Citation: Liu XL, Pan Q, Zhang RN, Shen F, Yan SY, Sun C, Xu ZJ, Chen YW, Fan JG. Disease-specific miR-34a as diagnostic marker of non-alcoholic steatohepatitis in a Chinese population. World J Gastroenterol 2016; 22(44): 9844-9852
- URL: https://www.wjgnet.com/1007-9327/full/v22/i44/9844.htm
- DOI: https://dx.doi.org/10.3748/wjg.v22.i44.9844


