Copyright
©The Author(s) 2016.
World J Gastroenterol. Jul 21, 2016; 22(27): 6201-6213
Published online Jul 21, 2016. doi: 10.3748/wjg.v22.i27.6201
Published online Jul 21, 2016. doi: 10.3748/wjg.v22.i27.6201
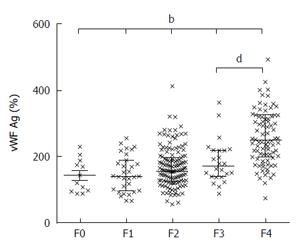
Figure 2 Dotplots for vFW: Ag according to fibrosis stage showing mean values and IQR.
bP < 0.001 for all fibrosis stages, F3 vs F4 dP < 0.0001[54]. With permission from John Wiley and sons.
- Citation: Janicko M, Drazilova S, Pella D, Fedacko J, Jarcuska P. Pleiotropic effects of statins in the diseases of the liver. World J Gastroenterol 2016; 22(27): 6201-6213
- URL: https://www.wjgnet.com/1007-9327/full/v22/i27/6201.htm
- DOI: https://dx.doi.org/10.3748/wjg.v22.i27.6201


