Copyright
©The Author(s) 2016.
World J Gastroenterol. Jan 7, 2016; 22(1): 417-426
Published online Jan 7, 2016. doi: 10.3748/wjg.v22.i1.417
Published online Jan 7, 2016. doi: 10.3748/wjg.v22.i1.417
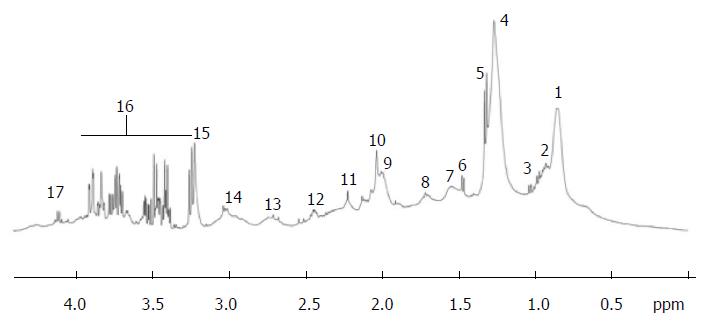
Figure 3 Typical proton nuclear magnetic resonance (500 MHz) spectra of the region between 0 and 6 ppm from cirrhotic patient.
Region between 4.5 and 5.0 ppm corresponding to the water and urea was suppressed. Peak assignment: 1: Fatty acids (-CH2-CH2-CH2-CH3); 2: Isoleucine; 3: Valine; 4: Fatty acids (-CH2-CH2-CH2-); 5: Lactate; 6: Alanine; 7: Fatty acids (-CH2-CH2-CO-); 8: Fatty acids (-CH2-CH2-CH=); 9: Fatty acids (=CH-CH2-CH2-); 10: Acetyl signals from α1-acid glycoprotein; 11: Fatty acids (-CH2-CO-); 12: Glutamine; 13: Fatty acids (=CH-CH2-CH=); 14: Albumin lysyl; 15: Choline; 16: Glucose; 17: Lactate; 18: Fatty acids (-CH=CH-). Adapted from Nahon et al[29].
- Citation: Amathieu R, Triba MN, Goossens C, Bouchemal N, Nahon P, Savarin P, Le Moyec L. Nuclear magnetic resonance based metabolomics and liver diseases: Recent advances and future clinical applications. World J Gastroenterol 2016; 22(1): 417-426
- URL: https://www.wjgnet.com/1007-9327/full/v22/i1/417.htm
- DOI: https://dx.doi.org/10.3748/wjg.v22.i1.417


